UChart
UChart is a chart for monitoring the defect rate when defects are rare.


Where  is the observed average
number of defects per unit and n is the number of inspection units.
is the observed average
number of defects per unit and n is the number of inspection units.
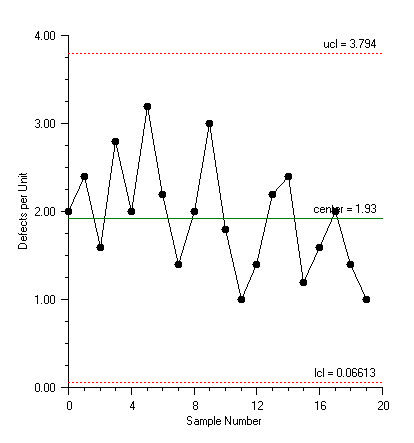
UChart Example
Samples Sizes are Equal
The number of defects in the manufacturing of computers was measured. There were 20 samples, each containing 5 computers. The center line is at 1.93, the average number of defects per computer (Montgomery 318).
using Imsl.Chart2D;
using Imsl.Chart2D.QC;
public class SampleUChart : FrameChart {
static int sampleSize = 5;
static int[] numberDefects = {
10, 12, 8, 14, 10, 16, 11, 7, 10, 15, 9, 5,
7, 11, 12, 6, 8, 10, 7, 5
};
public SampleUChart() {
Chart chart = this.Chart;
AxisXY axis = new AxisXY(chart);
UChart uchart = new UChart(axis, sampleSize, numberDefects);
axis.AxisX.AxisTitle.SetTitle("Sample Number");
axis.AxisX.AxisLabel.TextFormat = "0";
axis.AxisY.AxisTitle.SetTitle("Defects per Unit");
}
public static void Main(string[] argv) {
System.Windows.Forms.Application.Run(new SampleUChart());
}
}
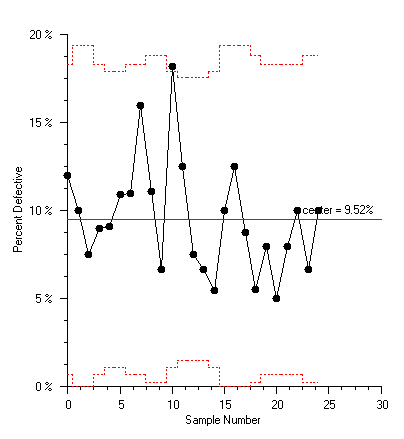
UChartUnequal Example
Unequal Sample Sizes
Defects in dying rolls of cloth were measured. The number of defects per 50 square meters was counted. Since the sizes of the rolls differed, the number of inspection units per roll varied. The center line is at 1.423, the average number of defects per 50 square meters (Montgomery, 321).
using Imsl.Chart2D;
using Imsl.Chart2D.QC;
public class SampleUChartUnequal : FrameChart {
static double[] inspectionUnitsPerRoll = {
10, 8, 13, 10, 9.5, 10, 12, 10.5, 12, 12.5
};
static int[] numberDefects = {
14, 12, 20, 11, 7, 10, 21, 16, 19, 23
};
public SampleUChartUnequal() {
Chart chart = this.Chart;
AxisXY axis = new AxisXY(chart);
UChart uchart = new UChart(axis, inspectionUnitsPerRoll, numberDefects);
axis.AxisX.AxisTitle.SetTitle("Sample Number");
axis.AxisX.AxisLabel.TextFormat = "0";
axis.AxisY.AxisTitle.SetTitle("Defects per Unit");
}
public static void Main(string[] argv) {
System.Windows.Forms.Application.Run(new SampleUChartUnequal());
}
}
|
PHONE: 713.784.3131 FAX:713.781.9260 |