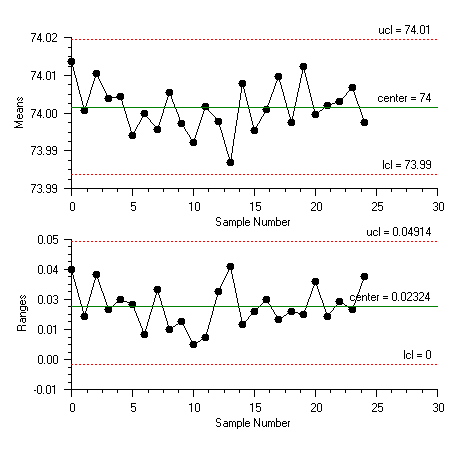
XbarRCombo Example
This example combines the XbarR chart with the corresponding RChart into a single chart. This is done by adjusting the Viewport attribute values for the two subcharts (Montgomery 215).
using Imsl.Chart2D;
using Imsl.Chart2D.QC;
public class SampleXbarRCombo : FrameChart {
static double[][] diameter = {
new double[] {74.03, 74.002, 74.019, 73.992, 74.008},
new double[] {73.995, 73.992, 74.001, 74.011, 74.004},
new double[] {73.988, 74.024, 74.021, 74.005, 74.002},
new double[] {74.002, 73.996, 73.993, 74.015, 74.009},
new double[] {73.992, 74.007, 74.015, 73.989, 74.014},
new double[] {74.009, 73.994, 73.997, 73.985, 73.993},
new double[] {73.995, 74.006, 73.994, 74, 74.005},
new double[] {73.985, 74.003, 73.993, 74.015, 73.988},
new double[] {74.008, 73.995, 74.009, 74.005, 74.004},
new double[] {73.998, 74, 73.99, 74.007, 73.995},
new double[] {73.994, 73.998, 73.994, 73.995, 73.99},
new double[] {74.004, 74, 74.007, 74, 73.996},
new double[] {73.983, 74.002, 73.998, 73.997, 74.012},
new double[] {74.006, 73.967, 73.994, 74, 73.984},
new double[] {74.012, 74.014, 73.998, 73.999, 74.007},
new double[] {74, 73.984, 74.005, 73.998, 73.996},
new double[] {73.994, 74.012, 73.986, 74.005, 74.007},
new double[] {74.006, 74.01, 74.018, 74.003, 74},
new double[] {73.984, 74.002, 74.003, 74.005, 73.997},
new double[] {74, 74.01, 74.013, 74.02, 74.003},
new double[] {73.982, 74.001, 74.015, 74.005, 73.996},
new double[] {74.004, 73.999, 73.99, 74.006, 74.009},
new double[] {74.01, 73.989, 73.99, 74.009, 74.014},
new double[] {74.015, 74.008, 73.993, 74, 74.01},
new double[] {73.982, 73.984, 73.995, 74.017, 74.013}
};
public SampleXbarRCombo() {
Chart chart = this.Chart;
ShewhartControlChart[] charts =
XbarR.CreateCharts(chart, diameter);
AxisXY axis = (AxisXY)(charts[0].Axis);
axis.AxisY.AutoscaleInput = Axis.AUTOSCALE_OFF;
axis.AxisY.SetWindow(73.985, 74.015);
}
public static void Main(string[] argv) {
System.Windows.Forms.Application.Run(new SampleXbarRCombo());
}
}
|
PHONE: 713.784.3131 FAX:713.781.9260 |