ancovar
Analyzes a one-way classification model with covariates.
Synopsis
#include <imsls.h>
float *imsls_f_ancovar (int ngroup, int ncov, int ni[], float y[], float x[],…, 0)
The type double function is imsls_d_ancovar.
Required Arguments
int ngroup (Input)
The number of treatment groups.
The number of treatment groups.
int ncov (Input)
The number of covariates.
The number of covariates.
int ni[] (Input)
Array of length ngroup containing the number of responses for each group.
Array of length ngroup containing the number of responses for each group.
float y[] (Input)
Array of length n containing the data for the response variable where n = ni[0] + ni[1] +…+ ni[ngroup-1].
Array of length n containing the data for the response variable where n = ni[0] + ni[1] +…+ ni[ngroup-1].
float x[] (Input)
Array of size n by ncov containing the data for the covariates.
Array of size n by ncov containing the data for the covariates.
Return Value
Pointer to an array of length 15 containing the one-way analysis of covariance assuming parallelism, organized as follows:
Element | Anova Table Value |
|---|---|
0 | Degrees of freedom for model (groups + covariates). |
1 | Degrees of freedom for error. |
2 | Total (corrected) degrees of freedom. |
3 | Sum of squares for model (groups and covariates combined). |
4 | Sum of squares for error. |
5 | Total (corrected) sum of squares. |
6 | Model mean square (groups and covariates combined). |
7 | Error mean square. |
8 | F-statistic. |
9 | p-value. |
10 | R2 (in percent). |
11 | Adjusted R2 (in percent). |
12 | Estimate of the standard deviation. |
13 | Overall response mean. |
14 | Coefficient of variation (in percent). |
Note that the p‑value is returned as 0.0 when the value is so small that all significant digits have been lost.
Synopsis with Optional Arguments
#include <imsls.h>
float *imsls_f_ancovar (int ngroup, int ncov, int ni[], float y[], float x[],
IMSLS_N_MISSING, int *nmiss,
IMSLS_ADJ_ANOVA, float **adj_aov,
IMSLS_ADJ_ANOVA_USER, float adj_aov[],
IMSLS_PARALLEL_TESTS, float **testpl,
IMSLS_PARALLEL_TESTS_USER, float testpl[],
IMSLS_XYMEAN, float **xymean,
IMSLS_XYMEAN_USER, float xymean[],
IMSLS_COEF, float **coef,
IMSLS_COEF_USER, float coef[],
IMSLS_COEF_TABLES, float **coef_tables,
IMSLS_COEF_TABLES_USER, float coef_tables[],
IMSLS_REG_ANOVA, float **aov_tables,
IMSLS_REG_ANOVA_USER, float aov_tables[],
IMSLS_R_MATRIX, float **r,
IMSLS_R_MATRIX_USER, float r[],
IMSLS_COV_MEANS, float **covm,
IMSLS_COV_MEANS_USER, float covm[],
IMSLS_COV_COEF, float **covb,
IMSLS_COV_COEF_USER, float covb[],
IMSLS_RETURN_USER, float aov[],
0)
Optional Arguments
IMSLS_N_MISSING, int *nmiss (Output)
The number of cases with missing values in x or y is returned in *nmiss. Cases with any missing values are not used in the analysis.
The number of cases with missing values in x or y is returned in *nmiss. Cases with any missing values are not used in the analysis.
IMSLS_ADJ_ANOVA, float **adj_aov (Output)
Address of a pointer to an internally allocated array of length 8 containing the partial sum of squares for the one-way analysis of covariance organized as follows:
Address of a pointer to an internally allocated array of length 8 containing the partial sum of squares for the one-way analysis of covariance organized as follows:
i | adj_aov[i] |
|---|---|
0 | Degrees of freedom for groups after covariates. |
1 | Degrees of freedom for covariates after groups. |
2 | Sum of squares for groups after covariates. |
3 | Sum of squares for model (groups and covariates combined). |
4 | F -statistic for groups. |
5 | F -statistic for covariates. |
6 | p-value for groups. |
7 | p-value for covariates. |
Note that the p-values are returned as 0.0 when the values are so small that all significant digits have been lost.
IMSLS_ADJ_ANOVA_USER, float adj_aov[] (Output)
Storage for the array adj_aov provided by the user. See IMSLS_ADJ_ANOVA for a description.
Storage for the array adj_aov provided by the user. See IMSLS_ADJ_ANOVA for a description.
IMSLS_PARALLEL_TESTS, float **testpl (Output)
Address of a pointer to an internally allocated array of length 10 containing the parallelism tests for the one-way analysis of covariance organized as follows:
Address of a pointer to an internally allocated array of length 10 containing the parallelism tests for the one-way analysis of covariance organized as follows:
i | testpl[i] |
|---|---|
0 | Extra degrees of freedom for model not assuming parallelism. |
1 | Degrees of freedom for error for model not assuming parallelism. |
2 | Degrees of freedom for error for model assuming parallelism. |
3 | Extra sum of squares for model not assuming parallelism. |
4 | Sum of squares for error for model not assuming parallelism. |
5 | Sum of squares for error for model assuming parallelism. |
6 | Mean square for testpl[0]. |
7 | Mean square for testpl[1]. |
8 | F –statistic. |
9 | p-value. |
IMSLS_PARALLEL_TESTS_USER, float testpl[] (Output)
Storage for the array testpl provided by the user. See IMSLS_PARALLEL_TESTS for a description.
Storage for the array testpl provided by the user. See IMSLS_PARALLEL_TESTS for a description.
IMSLS_XYMEAN, float **xymean (Output)
Address of a pointer to an internally allocated array of size ngroup+1 by ncov+3 containing the unadjusted means for the covariates and the response variate and the means for the response variate adjusted for the covariates. Each row for i = 0, 1, …, ngroup-1 corresponds to a group. Row ngroup contains overall statistics. The means are organized in xymean columns as follows:
Address of a pointer to an internally allocated array of size ngroup+1 by ncov+3 containing the unadjusted means for the covariates and the response variate and the means for the response variate adjusted for the covariates. Each row for i = 0, 1, …, ngroup-1 corresponds to a group. Row ngroup contains overall statistics. The means are organized in xymean columns as follows:
Column | Description |
|---|---|
0 | Number of non-missing cases |
1 thru ncov | Covariate means. |
ncov + 1 | Response mean. |
ncov + 2 | Response mean adjusted assuming parallelism. |
IMSLS_XYMEAN_USER, float xymean[] (Output)
Storage for the array xymean provided by the user. See IMSLS_XYMEAN for a description.
Storage for the array xymean provided by the user. See IMSLS_XYMEAN for a description.
IMSLS_COEF, float **coef (Output)
Address of a pointer to an internally allocated array of size ngroup + ncov by 4 containing statistics for the regression coefficients for the model assuming parallelism. Each row corresponds to a coefficient in the model. For i = 0, 1, …, ngroup-1, row i is for the y intercept for the i-th group. The remaining ncov rows are for the covariate coefficients. The statistics in the columns are organized as follows:
Address of a pointer to an internally allocated array of size ngroup + ncov by 4 containing statistics for the regression coefficients for the model assuming parallelism. Each row corresponds to a coefficient in the model. For i = 0, 1, …, ngroup-1, row i is for the y intercept for the i-th group. The remaining ncov rows are for the covariate coefficients. The statistics in the columns are organized as follows:
Column | Description |
|---|---|
0 | Coefficient estimate. |
1 | Estimated standard error of the estimate. |
2 | t-statistic. |
3 | p-value. |
IMSLS_COEF_USER, float coef[] (Output)
Storage for the array coef provided by the user. See IMSLS_COEF for a description.
Storage for the array coef provided by the user. See IMSLS_COEF for a description.
IMSLS_COEF_TABLES, float **coef_tables (Output)
Address of a pointer to an internally allocated array of size ngroup by ncov+1 by 4 containing statistics for a linear regression model fitted separately for each of the ngroup treatment groups. This array can be viewed as a 3 dimensional array with ngroup rows, ncov+1 columns, and depth of 4. Each row corresponds to one of the ngroup treatment groups. Each column corresponds to the model coefficients.
Address of a pointer to an internally allocated array of size ngroup by ncov+1 by 4 containing statistics for a linear regression model fitted separately for each of the ngroup treatment groups. This array can be viewed as a 3 dimensional array with ngroup rows, ncov+1 columns, and depth of 4. Each row corresponds to one of the ngroup treatment groups. Each column corresponds to the model coefficients.
For column = 0, the statistics relate to the intercept in the regression model. For column = 1, 2, …, ncov, the statistics relate to the slopes for the covariates. The depth dimension corresponds to the columns described for IMSLS_COEF as follows:
Column | Description |
|---|---|
0 | Coefficient estimate. |
1 | Estimated standard error of the estimate. |
2 | t-statistic. |
3 | p-value. |
IMSLS_COEF_TABLES_USER, float coef_tables[] (Output)
Storage for the array coef_tables provided by the user. See IMSLS_COEF_TABLES for a description.
Storage for the array coef_tables provided by the user. See IMSLS_COEF_TABLES for a description.
IMSLS_REG_ANOVA, float **aov_tables (Output)
Address of a pointer to an internally allocated array of size ngroup by 15 containing the analysis of variance tables for each linear regression model fitted separately to each treatment group. The 15 values in the i-th row are for treatment group i organized as follows:
Address of a pointer to an internally allocated array of size ngroup by 15 containing the analysis of variance tables for each linear regression model fitted separately to each treatment group. The 15 values in the i-th row are for treatment group i organized as follows:
j | aov_tables[i*15+j] |
|---|---|
0 | Degrees of freedom for regression model (covariates). |
1 | Degrees of freedom for error. |
2 | Total (corrected) degrees of freedom. |
3 | Sum of squares for regression model. |
4 | Sum of squares for error. |
5 | Total (corrected) sum of squares. |
6 | Model mean square. |
7 | Error mean square. |
8 | F-statistic. |
9 | p-value. |
10 | R2 (in percent). |
11 | Adjusted R2 (in percent). |
12 | Error standard deviation. |
13 | Overall response mean. |
14 | Coefficient of variation (in percent). |
Note that the p‑value is returned as 0.0 when the value is so small that all significant digits have been lost.
IMSLS_REG_ANOVA_USER, float aov_tables[] (Output)
Storage for the array aov_tables provided by the user. See IMSLS_REG_ANOVA for a description.
Storage for the array aov_tables provided by the user. See IMSLS_REG_ANOVA for a description.
IMSLS_R_MATRIX, float **r (Output)
Address of a pointer to an internally allocated array of size ngroup+ncov by ngroup + ncov containing the R matrix from the QR decomposition. The R matrix is from the regression assuming parallelism.
Address of a pointer to an internally allocated array of size ngroup+ncov by ngroup + ncov containing the R matrix from the QR decomposition. The R matrix is from the regression assuming parallelism.
IMSLS_R_MATRIX_USER, float r[] (Output)
Storage for the array r provided by the user. See IMSLS_R_MATRIX for a description.
Storage for the array r provided by the user. See IMSLS_R_MATRIX for a description.
IMSLS_COV_MEANS, float **covm (Output)
Address of a pointer to an internally allocated array of size ngroup by ngroup containing the estimated matrix of variances and covariances for the adjusted means assuming parallelism.
Address of a pointer to an internally allocated array of size ngroup by ngroup containing the estimated matrix of variances and covariances for the adjusted means assuming parallelism.
IMSLS_COV_MEANS_USER, float covm[] (Output)
Storage for the array covm provided by the user. See IMSLS_COV_MEANS for a description.
Storage for the array covm provided by the user. See IMSLS_COV_MEANS for a description.
IMSLS_COV_COEF, float **covb (Output)
Address of a pointer to an internally allocated array of size ngroup + ncov by ngroup+ncov containing the estimated matrix of variances and covariances for the coefficients in coef returned using IMSLS_COEF or IMSLS_COEF_USER.
Address of a pointer to an internally allocated array of size ngroup + ncov by ngroup+ncov containing the estimated matrix of variances and covariances for the coefficients in coef returned using IMSLS_COEF or IMSLS_COEF_USER.
IMSLS_COV_COEF_USER, float covb[] (Output)
Storage for the array covb provided by the user. See IMSLS_COV_COEF for a description.
Storage for the array covb provided by the user. See IMSLS_COV_COEF for a description.
IMSLS_RETURN_USER, float aov[] (Output)
An array of length 15 provided by the user for the return value. See Return Value above for a description.
An array of length 15 provided by the user for the return value. See Return Value above for a description.
Description
Function imsls_f_ancovar performs analyses for models that combine the features of a one-way analysis of variance model with that of a multiple linear regression model. The basic one-way analysis of covariance model is
where the observed value of yij constitutes the j-th response in the i-th group, denotes the y intercept for the regression function for the i-th group, β1, β2, …, βm are the regression coefficients for the covariates, and the ɛ ij’s are independently distributed normal errors with mean zero and variance σ2. This model allows the regression function for each group to have different intercepts. However, the remaining m regression coefficients are the same for each group, i.e., the regression functions are parallel.
In practice, sometimes the regression functions are not parallel. In addition to estimates for the model assuming parallelism, imsls_f_ancovar computes estimates and summary statistics for the separate regressions for each group. These estimates can be examined using the optional arguments IMSLS_COEF_TABLES and IMSLS_REG_ANOVA.
Estimates for the β0i’s and β1, β2, …, βm in the model assuming parallelism are returned using the optional argument IMSLS_COEF. Summary statistics are also computed for this model.
The adjusted group means, stored in the last column of xymean, are computed using the formula:
The estimated covariance between the i1-th and i2-th adjusted group mean is given by
where vpq is the entry in covb[(p - 1)(ngroup + ncov) + q -1] and is the estimated covariance between the p‑th and q‑th estimated coefficients in the regression function.
A discussion of formulas and interpretations for the one-way analysis of covariance problem appears in most elementary statistics texts, e.g., Snedecor and Cochran (1967, Chapter 14).
Examples
Example 1
This example fits a one-way analysis of covariance model assuming parallelism using data discussed by Snedecor and Cochran (Table 14.6.1, pages 432−436). The responses are concentrations of cholesterol (in mg/100 ml) in the blood of two groups of women: women from Iowa and women from Nebraska. Age of a woman is the single covariate. The cholesterol concentrations and ages of the women according to state are shown in the following table. (There are 11 Iowa women and 19 Nebraska women in the study. Only the first 5 women from each state are shown here.)
Iowa | Nebraska | ||
|---|---|---|---|
Age | Cholesterol | Age | Cholesterol |
46 | 181 | 18 | 137 |
52 | 228 | 44 | 173 |
39 | 182 | 33 | 177 |
65 | 249 | 78 | 241 |
54 | 259 | 51 | 225 |
There is no evidence from the data to indicate that the regression lines for cholesterol concentration as a function of age are not parallel for Iowa and Nebraska women (p-value is 0.5425). The parallel line model suggests that Nebraska women may have higher cholesterol concentrations than Iowa women. The cholesterol concentrations (adjusted for age) are 195.5 for Iowa women versus 224.2 for Nebraska women. The difference is 28.7 with an estimated standard error of
#include <imsls.h>
#include <stdio.h>
int main()
{
int ncov=1, ngroup=2;
int ni[2] = {11, 19};
float *testpl, *aov, *xymean, *covm;
float y[30] = {
181.0, 228.0, 182.0, 249.0, 259.0,
201.0, 121.0, 339.0, 224.0, 112.0,
189.0, 137.0, 173.0, 177.0, 241.0,
225.0, 223.0, 190.0, 257.0, 337.0,
189.0, 214.0, 140.0, 196.0, 262.0,
261.0, 356.0, 159.0, 191.0, 197.0
};
float x[30] = {
46.0, 52.0, 39.0, 65.0, 54.0,
33.0, 49.0, 76.0, 71.0, 41.0,
58.0, 18.0, 44.0, 33.0, 78.0,
51.0, 43.0, 44.0, 58.0, 63.0,
19.0, 42.0, 30.0, 47.0, 58.0,
70.0, 67.0, 31.0, 21.0, 56.0
};
aov = imsls_f_ancovar(ngroup, ncov, ni, y, x,
IMSLS_PARALLEL_TESTS, &testpl,
IMSLS_XYMEAN, &xymean,
IMSLS_COV_MEANS, &covm, 0);
printf(" * * * ANALYSIS OF VARIANCE * * * \n");
printf(" Sum of Mean Prob of\n");
printf("Source DF Squares Square Overall F Larger F\n");
printf("Model %3.0f %10.2f %9.2f %2.2f %8.6f\n",
aov[0], aov[3], aov[6], aov[8], aov[9]);
printf("Error %3.0f %10.2f %9.2f \n", aov[1], aov[4], aov[7]);
printf("Total %3.0f %10.2f \n", aov[2], aov[5]);
printf("\n");
printf(" * * * TEST FOR PARALLELISM * * * \n");
printf(" Sum of Mean F Prob of\n");
printf("SOURCE DF Squares Square TEST Larger F\n");
printf("Extra due to\n");
printf("Nonparallelism %3.0f %10.2f %7.2f %7.5f %5.4f\n",
testpl[0], testpl[3], testpl[6], testpl[8], testpl[9]);
printf("Extra Assuming\n");
printf("Nonparallelism %3.0f %10.2f %7.2f \n", testpl[1], testpl[4],
testpl[7]);
printf("Error Assuming\n");
printf("Parallelism %3.0f %10.2f \n", testpl[2], testpl[5]);
imsls_f_write_matrix("\nXY Mean Matrix\n", ngroup+1, 4, xymean, 0);
imsls_f_write_matrix("\nVar./Covar. Matrix of Adjusted Group Means\n",
ngroup, ngroup, covm, 0);
}
Output
* * * ANALYSIS OF VARIANCE * * *
Sum of Mean Prob of
Source DF Squares Square Overall F Larger F
Model 2 54432.77 27216.39 14.97 0.000042
Error 27 49103.91 1818.66
Total 29 103536.69
* * * TEST FOR PARALLELISM * * *
Sum of Mean F Prob of
SOURCE DF Squares Square TEST Larger F
Extra due to
Nonparallelism 1 709.05 709.05 0.38094 0.5425
Extra Assuming
Nonparallelism 26 48394.86 1861.34
Error Assuming
Parallelism 27 49103.91
XY Mean Matrix
1 2 3 4
1 11.0 53.1 207.7 195.5
2 19.0 45.9 217.1 224.2
3 30.0 48.6 213.7 213.7
Var./Covar. Matrix of Adjusted Group Means
1 2
1 170.4 -2.9
2 -2.9 97.4
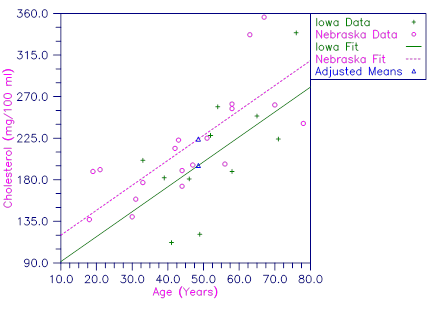
Figure 7, Plot of Cholesterol Concentrations and Fitted Parallel Lines by State
Example 2
This example fits a one-way analysis of covariance model and performs a test for parallelism using data discussed by Snedecor and Cochran (1967, Table 14.8.1, pages 438-443). The responses are weight gains (in pounds per day) of 40 pigs for four groups of pigs under varying treatments. Two covariates-initial age (in days) and initial weight (in pounds) are used. For each treatment, there are 10 pigs. Only the first five pigs from each treatment are shown here.
Treatment 1 | Treatment 2 | Treatment 3 | Treatment 4 | ||||||||
|---|---|---|---|---|---|---|---|---|---|---|---|
Age | Wt. | Gain | Age | Wt. | Gain | Age | Wt. | Gain | Age | Wt. | Gain |
78 | 61 | 1.40 | 78 | 74 | 1.61 | 78 | 80 | 1.67 | 77 | 62 | 1.40 |
90 | 59 | 1.79 | 99 | 75 | 1.31 | 83 | 61 | 1.41 | 71 | 55 | 1.47 |
94 | 76 | 1.72 | 80 | 64 | 1.12 | 79 | 62 | 1.73 | 78 | 62 | 1.37 |
71 | 50 | 1.47 | 75 | 48 | 1.35 | 70 | 47 | 1.23 | 70 | 43 | 1.15 |
99 | 61 | 1.26 | 94 | 62 | 1.29 | 85 | 59 | 1.49 | 95 | 57 | 1.22 |
For these data, the test for non-parallelism is not statistically significant (p = 0.901). The one-way analysis of covariance test for the treatment means adjusted for the covariates, assuming parallel slopes, is statistically significant at a stated significance level of α = 0.05, (p = 0.04931).
Multiple comparisons can be done using the least significant difference approach of comparing each pair of treatment groups with the two-sample student-t test. Since the adjusted means in the one-way analysis of covariance are correlated, the standard error for these comparisons must be computed using the variances and covariances in covm. The standard errors for these comparisons are fairly similar ranging from 0.0630 to 0.0638. The Student’s t comparisons identify differences between groups 1 and 2, and 1 and 4 as being statistically significant with p-values of 0.01225 and 0.03854 respectively.
#include <imsls.h>
#include <stdio.h>
#include <math.h>
int main()
{
int i, j;
int ncov=2, ngroup=4, nobs=40;
int ni[4] = {10, 10, 10, 10};
float aov[15], testpl[10], adj_aov[8], xymean[5*5], covm[4*4];
float x1[40] = {
78.0, 90.0, 94.0, 71.0, 99.0, 80.0, 83.0, 75.0, 62.0, 67.0,
78.0, 99.0, 80.0, 75.0, 94.0, 91.0, 75.0, 63.0, 62.0, 67.0,
78.0, 83.0, 79.0, 70.0, 85.0, 83.0, 71.0, 66.0, 67.0, 67.0,
77.0, 71.0, 78.0, 70.0, 95.0, 96.0, 71.0, 63.0, 62.0, 67.0
};
float x2[40] = {
61.0, 59.0, 76.0, 50.0, 61.0, 54.0, 57.0, 45.0, 41.0, 40.0,
74.0, 75.0, 64.0, 48.0, 62.0, 42.0, 52.0, 43.0, 50.0, 40.0,
80.0, 61.0, 62.0, 47.0, 59.0, 42.0, 47.0, 42.0, 40.0, 40.0,
62.0, 55.0, 62.0, 43.0, 57.0, 51.0, 41.0, 40.0, 45.0, 39.0,
};
float y[40] = {
1.40, 1.79, 1.72, 1.47, 1.26, 1.28, 1.34, 1.55, 1.57, 1.26,
1.61, 1.31, 1.12, 1.35, 1.29, 1.24, 1.29, 1.43, 1.29, 1.26,
1.67, 1.41, 1.73, 1.23, 1.49, 1.22, 1.39, 1.39, 1.56, 1.36,
1.40, 1.47, 1.37, 1.15, 1.22, 1.48, 1.31, 1.27, 1.22, 1.36
};
float x[40*2], stderror, delta, t, df, pvalue;
/* setup covariate input matrix */
for(i=0; i<nobs; i++){
x[i*ncov ] = x1[i];
x[i*ncov+1] = x2[i];
}
imsls_f_ancovar(ngroup, ncov, ni, y, x,
IMSLS_PARALLEL_TESTS_USER, testpl,
IMSLS_ADJ_ANOVA_USER, adj_aov,
IMSLS_XYMEAN_USER, xymean,
IMSLS_COV_MEANS_USER, covm,
IMSLS_RETURN_USER, aov,
0);
printf("\n");
printf(" * * * TEST FOR PARALLELISM * * * \n");
printf(" Sum of Mean F Prob "
"of\n");
printf("SOURCE DF Squares Square TEST Larger "
"F\n");
printf("Extra due to\n");
printf("Nonparallelism %3.0f %10.2f %7.2f %7.5f %5.3f\n",
testpl[0], testpl[3], testpl[6], testpl[8], testpl[9]);
printf("Extra Assuming\n");
printf("Nonparallelism %3.0f %10.2f %7.2f \n",
testpl[1], testpl[4], testpl[7]);
printf("Error Assuming\n");
printf("Parallelism %3.0f %10.2f \n", testpl[2], testpl[5]);
printf("\n");
printf(" * * * ANALYSIS OF VARIANCE * * * \n");
printf(" Sum of Mean Prob "
"of\n");
printf("Source DF Squares Square Overall F Larger"
"F\n");
printf("Model %3.0f %f %f %f %5.4f\n",
aov[0], aov[3], aov[6], aov[8], aov[9]);
printf("Error %3.0f %f %f \n", aov[1], aov[4],
aov[7]);
printf("Total %3.0f %f \n", aov[2], aov[5]);
printf("\n");
printf(" * * * ADJUSTED ANALYSIS OF VARIANCE * * * \n");
printf(" Sum of F Prob "
"of\n");
printf("Source DF Squares TEST Larger "
"F\n");
printf("Groups after Covariates %3.0f %10.2f %5.2f %7.5f\n",
adj_aov[0], adj_aov[2], adj_aov[4], adj_aov[6]);
printf("Covariates after Groups %3.0f %10.2f %5.2f %7.5f\n",
adj_aov[1], adj_aov[3], adj_aov[5], adj_aov[7]);
printf("\n * * * GROUP MEANS * * * \n");
printf("GROUP | Unadjusted | Adjusted | Std. Error\n");
for(i=0; i<ngroup; i++) {
stderror = sqrt(covm[i*ngroup + i]);
printf(" %d | %5.4f | %5.4f | %7.4f\n", i+1,
xymean[i*(ngroup+1)+ngroup-1], xymean[i*(ngroup+1)+ngroup],
stderror);
}
printf("\n * * * STUDENT-T MULTIPLE COMPARISONS * * * \n");
printf(" GROUPS | DIFF | Std. Error | Student-t | P-Value\n");
for(i=0; i<ngroup-1; i++){
for(j=i+1; j<ngroup; j++){
delta = xymean[i*(ngroup+1)+ngroup] -
xymean[j*(ngroup+1)+ngroup];
stderror = sqrt(covm[i*ngroup+i]+covm[j*ngroup+j]-
2.0*covm[i*ngroup+j]);
t = delta/stderror;
df = xymean[i*(ngroup+1)]+xymean[j*(ngroup+1)]-2;
pvalue = 1.0 - imsls_f_t_cdf(t, df);
printf(" %d vs %d | %7.4f | %7.4f | %7.3f | "
"%7.5f\n", i+1, j+1, delta, stderror, t, pvalue);
}
}
}
Output
* * * TEST FOR PARALLELISM * * *
Sum of Mean F Prob of
SOURCE DF Squares Square TEST Larger F
Extra due to
Nonparallelism 6 0.05 0.01 0.35534 0.901
Extra Assuming
Nonparallelism 28 0.62 0.02
Error Assuming
Parallelism 34 0.67
* * * ANALYSIS OF VARIANCE * * *
Sum of Mean Prob of
Source DF Squares Square Overall F Larger F
Model 5 0.352517 0.070503 3.576395 0.0105
Error 34 0.670261 0.019714
Total 39 1.022778
* * * ADJUSTED ANALYSIS OF VARIANCE * * *
Sum of F Prob of
Source DF Squares TEST Larger F
Groups after Covariates 3 0.17 2.90 0.04931
Covariates after Groups 2 0.17 4.44 0.01939
* * * GROUP MEANS * * *
GROUP | Unadjusted | Adjusted | Std. Error
1 | 1.4640 | 1.4614 | 0.0448
2 | 1.3190 | 1.3068 | 0.0446
3 | 1.4450 | 1.4429 | 0.0447
4 | 1.3250 | 1.3418 | 0.0449
* * * STUDENT-T MULTIPLE COMPARISONS * * *
GROUPS | DIFF | Std. Error | Student-t | P-Value
1 vs 2 | 0.1546 | 0.0630 | 2.455 | 0.01225
1 vs 3 | 0.0185 | 0.0637 | 0.290 | 0.38750
1 vs 4 | 0.1196 | 0.0638 | 1.875 | 0.03854
2 vs 3 | -0.1362 | 0.0632 | -2.153 | 0.97743
2 vs 4 | -0.0350 | 0.0638 | -0.549 | 0.70528
3 vs 4 | 0.1011 | 0.0631 | 1.602 | 0.06330


