RLINE
Fits a line to a set of data points using least squares.
Required Arguments
XDATA — Vector of length NOBS containing the x-values. (Input)
YDATA — Vector of length NOBS containing the y-values. (Input)
B0 — Estimated intercept of the fitted line. (Output)
B1 — Estimated slope of the fitted line. (Output)
Optional Arguments
NOBS — Number of observations. (Input)
Default: NOBS = size (XDATA,1).
Default: NOBS = size (XDATA,1).
STAT — Vector of length 12 containing the statistics described below. (Output)
I | STAT(I) |
|---|---|
1 | Mean of XDATA |
2 | Mean of YDATA |
3 | Sample variance of XDATA |
4 | Sample variance of YDATA |
5 | Correlation |
6 | Estimated standard error of B0 |
7 | Estimated standard error of B1 |
8 | Degrees of freedom for regression |
9 | Sum of squares for regression |
10 | Degrees of freedom for error |
11 | Sum of squares for error |
12 | Number of (x, y) points containing NaN (not a number) as either the x or y value |
FORTRAN 90 Interface
Generic: CALL RLINE (XDATA, YDATA, B0, B1 [, …])
Specific: The specific interface names are S_RLINE and D_RLINE.
FORTRAN 77 Interface
Single: CALL RLINE (NOBS, XDATA, YDATA, B0, B1, STAT)
Double: The double precision name is DRLINE.
Description
Routine RLINE fits a line to a set of (x, y) data points using the method of least squares. Draper and Smith (1981, pages 1− 69) discuss the method. The fitted model is
where (stored in B0) is the estimated intercept and (stored in B1) is the estimated slope. In addition to the fit, RLINE produces some summary statistics, including the means, sample variances, correlation, and the error (residual) sum of squares. The estimated standard errors of are computed under the simple linear regression model. The errors in the model are assumed to be uncorrelated and with constant variance.
If the x values are all equal, the model is degenerate. In this case, RLINE sets to zero and to the mean of the y values.
Comments
Informational error
Type | Code | Description |
|---|---|---|
4 | 1 | Each (x, y) point contains NaN (not a number). There are no valid data. |
Example
This example fits a line to a set of data discussed by Draper and Smith (1981, Table 1.1, pages 9-33). The response y is the amount of steam used per month (in pounds), and the independent variable x is the average atmospheric temperature (in degrees Fahrenheit).
USE RLINE_INT
USE UMACH_INT
USE WRRRL_INT
IMPLICIT NONE
INTEGER NOBS
PARAMETER (NOBS=25)
!
INTEGER NOUT
REAL B0, B1, STAT(12), XDATA(NOBS), YDATA(NOBS)
CHARACTER CLABEL(13)*15, RLABEL(1)*4
!
DATA XDATA/35.3, 29.7, 30.8, 58.8, 61.4, 71.3, 74.4, 76.7, 70.7,&
57.5, 46.4, 28.9, 28.1, 39.1, 46.8, 48.5, 59.3, 70.0, 70.0,&
74.5, 72.1, 58.1, 44.6, 33.4, 28.6/
DATA YDATA/10.98, 11.13, 12.51, 8.4, 9.27, 8.73, 6.36, 8.5,&
7.82, 9.14, 8.24, 12.19, 11.88, 9.57, 10.94, 9.58, 10.09,&
8.11, 6.83, 8.88, 7.68, 8.47, 8.86, 10.36, 11.08/
DATA RLABEL/'NONE'/, CLABEL/' ', 'Mean of X', 'Mean of Y',&
'Variance X', 'Variance Y', 'Corr.', 'Std. Err. B0',&
'Std. Err. B1', 'DF Reg.', 'SS Reg.', 'DF Error',&
'SS Error', 'Pts. with NaN'/
!
CALL RLINE (XDATA, YDATA, B0, B1, STAT=STAT)
!
CALL UMACH (2, NOUT)
WRITE (NOUT,99999) B0, B1
99999 FORMAT (' B0 = ', F7.2, ' B1 = ', F9.5)
CALL WRRRL ('%/STAT', STAT, RLABEL, CLABEL, 1, 12, 1, &
FMT = '(12W10.4)')
!
END
Output
B0 = 13.62 B1 = -0.07983
STAT
Mean of X Mean of Y Variance X Variance Y Corr. Std. Err. B0
52.6 9.424 298.1 2.659 -0.8452 0.5815
Std. Err. B1 DF Reg. SS Reg. DF Error SS Error Pts. with NaN
0.01052 1 45.59 23 18.22 0
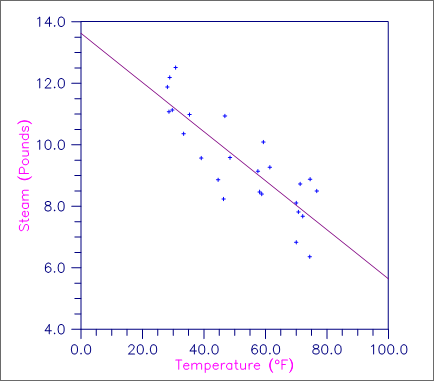
Figure 7, Plot of the Data and the Least Squares Line
Published date: 03/19/2020
Last modified date: 03/19/2020


