JMSL Chart Programmer's Guide


JMSL Chart Programmer's Guide
|
Quality Control and Improvement Charts >> CChart |
|
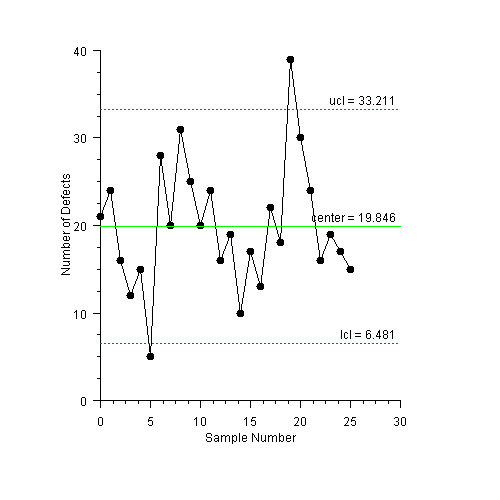
CChart
CChart plots the number of defects or nonconformities.

The number of defects in samples of 100 printed circuit boards was measured (Montgomery 321).
(Download Code)import com.imsl.chart.*;
import com.imsl.chart.qc.*;
public class SampleCChart extends JFrameChart {
static final int numberDefects[] = {
21, 24, 16, 12, 15, 5, 28, 20, 31, 25, 20, 24,
16, 19, 10, 17, 13, 22, 18, 39, 30, 24, 16, 19,
17, 15
};
public SampleCChart() {
Chart chart = getChart();
AxisXY axis = new AxisXY(chart);
CChart cchart = new CChart(axis, numberDefects);
axis.getAxisX().getAxisTitle().setTitle("Sample Number");
axis.getAxisX().getAxisLabel().setTextFormat("0");
axis.getAxisY().getAxisTitle().setTitle("Number of Defects");
}
public static void main(String argv[]) {
new SampleCChart().setVisible(true);
}
}
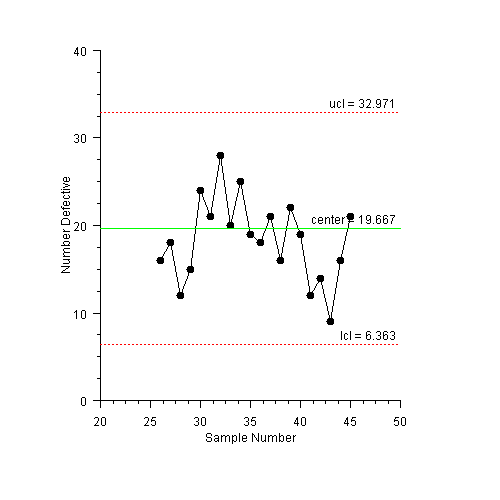
CChartOmit Example
This is similar to the previous chart, but two points are omitted from the statistical computations.
To do this, first the censored chart is created with the bad points omitted. The positions of the control limits in this chart are saved. This censored chart is then removed from the chart.
The second step is to create a chart using later data points, but with the position of the control limit limits set to the values computed using the censored data.
(Download Code)import com.imsl.chart.*;
import com.imsl.chart.qc.*;
public class SampleCChartOmit extends JFrameChart {
static final int censoredNumberDefects[] = {
21, 24, 16, 12, 15, /*5,*/ 28, 20, 31, 25, 20, 24,
16, 19, 10, 17, 13, 22, 18, /*39,*/ 30, 24, 16, 19,
17, 15
};
static final int furtherNumberDefects[] = {
16, 18, 12, 15, 24, 21, 28, 20, 25,
19, 18, 21, 16, 22, 19, 12, 14, 9, 16, 21
};
public SampleCChartOmit() {
Chart chart = getChart();
AxisXY axis = new AxisXY(chart);
CChart censoredCChart = new CChart(axis, censoredNumberDefects);
double lcl = censoredCChart.getLowerControlLimit().getValue()[0];
double center = censoredCChart.getCenter();
double ucl = censoredCChart.getUpperControlLimit().getValue()[0];
censoredCChart.remove();
double x[] = new double[furtherNumberDefects.length];
for (int i = 0; i < x.length; i++) {
x[i] = SampleCChart.numberDefects.length + i;
}
CChart fullCChart = new CChart(axis, furtherNumberDefects);
fullCChart.getControlData().setX(x);
fullCChart.getLowerControlLimit().setValue(lcl);
fullCChart.getCenterLine().setValue(center);
fullCChart.getUpperControlLimit().setValue(ucl);
axis.getAxisX().getAxisTitle().setTitle("Sample Number");
axis.getAxisX().getAxisLabel().setTextFormat("0");
axis.getAxisY().getAxisTitle().setTitle("Number Defective");
}
public static void main(String argv[]) {
new SampleCChartOmit().setVisible(true);
}
}
| © Visual Numerics, Inc. All rights reserved. |
|