JMSL Chart Programmer's Guide


JMSL Chart Programmer's Guide
|
Quality Control and Improvement Charts >> UChart |
|
UChart

Where  is the observed average number of defects per unit and n is the number
of inspection units.
is the observed average number of defects per unit and n is the number
of inspection units.
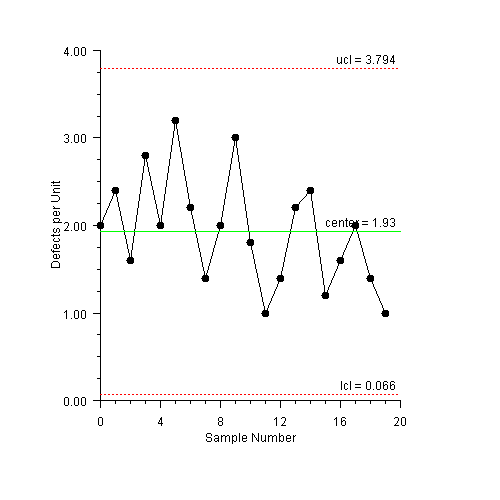
UChart Example
Samples Sizes are Equal
The number of defects in the manufacturing of computers was measured. There were 20 samples, each containing 5 computers. The center line is at 1.93, the average number of defects per computer (Montgomery 318).
(Download Code)import com.imsl.chart.*;
import com.imsl.chart.qc.*;
public class SampleUChart extends JFrameChart {
static final int sampleSize = 5;
static final int numberDefects[] = {
10, 12, 8, 14, 10, 16, 11, 7, 10, 15, 9, 5,
7, 11, 12, 6, 8, 10, 7, 5
};
public SampleUChart() {
Chart chart = getChart();
AxisXY axis = new AxisXY(chart);
new UChart(axis, sampleSize, numberDefects);
axis.getAxisX().getAxisTitle().setTitle("Sample Number");
axis.getAxisX().getAxisLabel().setTextFormat("0");
axis.getAxisY().getAxisTitle().setTitle("Defects per Unit");
}
public static void main(String argv[]) {
new SampleUChart().setVisible(true);
}
}
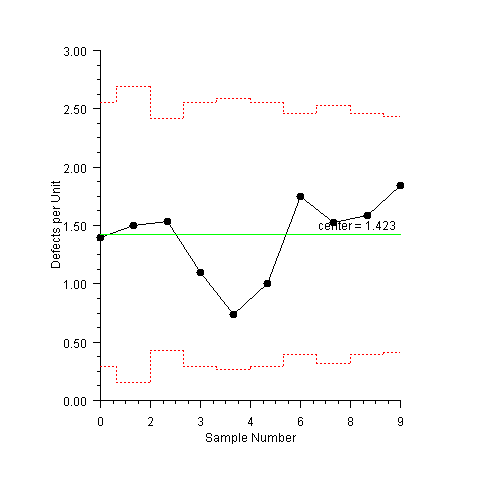
UChartUnequal Example
Unequal Sample Sizes
Defects in dying rolls of cloth were measured. The number of defects per 50 square meters was counted. Since the sizes of the rolls differed, the number of inspection units per roll varied. The center line is at 1.423, the average number of defects per 50 square meters (Montgomery, 321).
(Download Code)
import com.imsl.chart.*;
import com.imsl.chart.qc.*;

public class SampleUChartUnequal extends JFrameChart {
    static final double inspectionUnitsPerRoll[] = {
        10, 8, 13, 10, 9.5, 10, 12, 10.5, 12, 12.5
    };
    static final int numberDefects[] = {
        14, 12, 20, 11, 7, 10, 21, 16, 19, 23
    };

    public SampleUChartUnequal() {
        Chart chart = getChart();
        AxisXY axis = new AxisXY(chart);
        new UChart(axis, inspectionUnitsPerRoll, numberDefects);

        axis.getAxisX().getAxisTitle().setTitle("Sample Number");
        axis.getAxisX().getAxisLabel().setTextFormat("0");
        axis.getAxisY().getAxisTitle().setTitle("Defects per Unit");
    }


    public static void main(String argv[]) {
        new SampleUChartUnequal().setVisible(true);
    }
}
| © Visual Numerics, Inc. All rights reserved. |
|