- java.lang.Object
-
- com.imsl.chart.AbstractChartNode
-
- com.imsl.chart.ChartNode
-
- com.imsl.chart.Data
-
- com.imsl.chart.qc.ShewhartControlChart
-
- com.imsl.chart.qc.NpChart
-
- All Implemented Interfaces:
- Serializable, Cloneable
public class NpChart
extends ShewhartControlChart
NpChartis an np-chart for monitoring the number of defects when defects are not rare.Control limits are computed using the binomial distribution. If defects are rare
CChartshould be used instead. The control limits are at
where p is the is the proportion of defective items, n is the sample size, and k is the value of the "ControlLimit" attribute for the line. By default, the chart contains an upper control limit line with k=3, a lower control limit line with k=-3, and a central line equal to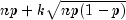
 .
If
.
If  is the proportion defective then the equation can be written as
Additional control limits can be added. The method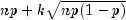
addWecoadds control limits with k = -2, -1, 1, 2. The lower control limit is forced to have a minimum value of zero. The y-axis labels are formatted as integers.- See Also:
- Example, Serialized Form
-
-
Field Summary
-
Fields inherited from class com.imsl.chart.qc.ShewhartControlChart
d2, d3
-
Fields inherited from class com.imsl.chart.ChartNode
AXIS_X_TOP, AXIS_Y_RIGHT, BAR_TYPE_HORIZONTAL, BAR_TYPE_VERTICAL, DASH_PATTERN_DASH, DASH_PATTERN_DASH_DOT, DASH_PATTERN_DOT, DASH_PATTERN_SOLID, DATA_TYPE_FILL, DATA_TYPE_LINE, DATA_TYPE_MARKER, DATA_TYPE_PICTURE, DATA_TYPE_TUBE, DENDROGRAM_TYPE_HORIZONTAL, DENDROGRAM_TYPE_VERTICAL, FILL_TYPE_GRADIENT, FILL_TYPE_NONE, FILL_TYPE_PAINT, FILL_TYPE_SOLID, LABEL_TYPE_PERCENT, MARKER_TYPE_ASTERISK, MARKER_TYPE_CIRCLE_CIRCLE, MARKER_TYPE_CIRCLE_PLUS, MARKER_TYPE_CIRCLE_X, MARKER_TYPE_DIAMOND_PLUS, MARKER_TYPE_FILLED_CIRCLE, MARKER_TYPE_FILLED_DIAMOND, MARKER_TYPE_FILLED_SQUARE, MARKER_TYPE_FILLED_TRIANGLE, MARKER_TYPE_HOLLOW_CIRCLE, MARKER_TYPE_HOLLOW_DIAMOND, MARKER_TYPE_HOLLOW_SQUARE, MARKER_TYPE_HOLLOW_TRIANGLE, MARKER_TYPE_OCTAGON_PLUS, MARKER_TYPE_OCTAGON_X, MARKER_TYPE_PLUS, MARKER_TYPE_SQUARE_PLUS, MARKER_TYPE_SQUARE_X, MARKER_TYPE_X, TEXT_X_CENTER, TEXT_X_LEFT, TEXT_X_RIGHT, TEXT_Y_BOTTOM, TEXT_Y_CENTER, TEXT_Y_TOP
-
Fields inherited from class com.imsl.chart.AbstractChartNode
AUTOSCALE_DATA, AUTOSCALE_DENSITY, AUTOSCALE_NUMBER, AUTOSCALE_OFF, AUTOSCALE_WINDOW, AXIS_X, AXIS_Y, AXIS_Z, LABEL_TYPE_NONE, LABEL_TYPE_TITLE, LABEL_TYPE_X, LABEL_TYPE_Y, LABEL_TYPE_Z, TRANSFORM_CUSTOM, TRANSFORM_LINEAR, TRANSFORM_LOG
-
-
Constructor Summary
Constructors Constructor and Description NpChart(AxisXY axis, int[] sampleSize, int[] numberDefective)Creates a np-Chart given the number of defects in a series of samples, where the number of observations per sample is not constant.NpChart(AxisXY axis, int sampleSize, int[] numberDefective)Creates an np-Chart given the number of defects in a series of samples.
-
Method Summary
Methods Modifier and Type Method and Description voidprePaint()Setup chart with current settings.-
Methods inherited from class com.imsl.chart.qc.ShewhartControlChart
addCenterLine, addControlLimit, addLowerControlLimit, addUpperControlLimit, addWecoLimits, dataRange, getCenter, getCenterLine, getControlData, getLowerControlLimit, getMeanSampleSize, getSampleSize, getUpperControlLimit, paint, removeControlLimit, setCenter, setData, setData, setSampleSize, setSampleSize, setX
-
Methods inherited from class com.imsl.chart.Data
formatLabel
-
Methods inherited from class com.imsl.chart.ChartNode
addPickListener, firePickListeners, getALT, getAxis, getBackground, getBarGap, getBarType, getBarWidth, getChart, getChartTitle, getChildren, getClipData, getComponent, getConcatenatedViewport, getDataType, getDoubleBuffering, getExplode, getFillOutlineColor, getFillOutlineType, getFillPaint, getFillType, getGradient, getHREF, getLegend, getLineDashPattern, getMarkerDashPattern, getMarkerThickness, getMarkerType, getParent, getReference, getScreenAxis, getScreenSize, getScreenViewport, getSize, getSkipWeekends, getTextAngle, getTextColor, getTitle, getToolTip, getViewport, isBitSet, removePickListener, setALT, setBarGap, setBarType, setBarWidth, setChartTitle, setClipData, setCustomTransform, setDataType, setDoubleBuffering, setExplode, setFillOutlineColor, setFillOutlineColor, setFillOutlineType, setFillPaint, setFillPaint, setFillPaint, setFillType, setGradient, setGradient, setGradient, setHREF, setImage, setLineDashPattern, setMarkerDashPattern, setMarkerThickness, setMarkerType, setReference, setScreenSize, setSize, setSkipWeekends, setTextAngle, setTextColor, setTextColor, setTitle, setTitle, setToolTip, setViewport, setViewport
-
Methods inherited from class com.imsl.chart.AbstractChartNode
clone, clone, clone, clone, getAbstractParent, getAttribute, getAutoscaleInput, getAutoscaleMinimumTimeInterval, getAutoscaleOutput, getBooleanAttribute, getChildList, getColorAttribute, getCustomTransform, getDensity, getDoubleAttribute, getFillColor, getFont, getFontName, getFontSize, getFontStyle, getImage, getIntegerAttribute, getLabelType, getLightColor, getLineColor, getLineWidth, getLocale, getMarkerColor, getMarkerSize, getName, getNumber, getPaint, getStringAttribute, getTextFormat, getTickLength, getTransform, getX, getY, isAncestorOf, isAttributeSet, isAttributeSetAtThisNode, parseColor, remove, setAttribute, setAutoscaleInput, setAutoscaleMinimumTimeInterval, setAutoscaleOutput, setDensity, setFillColor, setFillColor, setFont, setFontName, setFontSize, setFontStyle, setImage, setLabelType, setLightColor, setLightColor, setLineColor, setLineColor, setLineWidth, setLocale, setMarkerColor, setMarkerColor, setMarkerSize, setName, setNumber, setPaint, setTextFormat, setTextFormat, setTickLength, setTransform, setX, setY, toString
-
-
-
-
Constructor Detail
-
NpChart
public NpChart(AxisXY axis,
       int[] sampleSize,
       int[] numberDefective)
Creates a np-Chart given the number of defects in a series of samples, where the number of observations per sample is not constant.- Parameters:
axis- theAxisXYparent of this node.sampleSize- is an array containg the number of observations in each sample. Each sample must contain at least one observation.numberDefective- is an array containing the number of defects in each of a series of samples. All of its entries must be nonnegative.
-
NpChart
public NpChart(AxisXY axis,
       int sampleSize,
       int[] numberDefective)
Creates an np-Chart given the number of defects in a series of samples.- Parameters:
axis- theAxisXYparent of this node.sampleSize- is the number of observations in each sample. It must be at least one.numberDefective- is an array containing the number of defects in each of a series of samples. All of its entries must be nonnegative.
-
-