

IMSL C# Programmer’s Guide
|
Quality Control and Improvement Charts >> Cumulative Probability |


|
Cumulative Probability
If the defect rate is very small there will be long runs when the number of defects
is zero. In this situation the CChart and UChart are ineffective. An alternative
to defect counts is to measure the time between defects.
If the distribution of defect occurrences is Poisson, then the distribution of times
between defects is exponential. Unfortunately the exponential distribution is highly
skewed. Nelson suggested transforming to Weibull random variables using the
transformation 
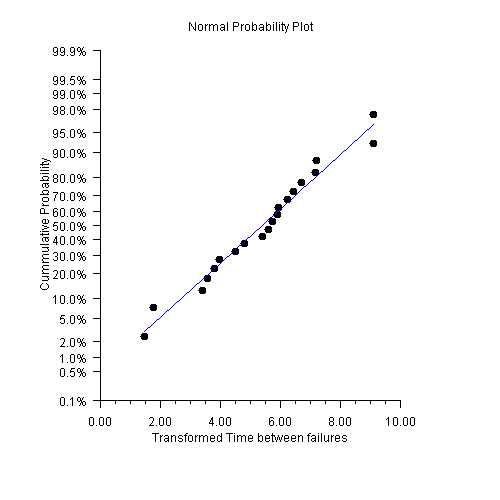
CumulativeProbability Example
The number of hours between failures is measured. A normal probability plot is constructed from the transformed data. A linear regression to the transformed data is also computed. To fit a regression with the normal probability axis, the regression variable needs to be transformed using the inverse normal cumulative distribution function (Montgomery, Example 6-21, 327).
(Download Code)using Imsl.Chart2D;
using Imsl.Chart2D.QC;
using Imsl.Stat;
public class SampleCumulativeProbability : FrameChart {
static double[] timeBetweenFailures = {
286, 948, 536, 124, 816, 729, 4, 143, 431, 8, 2837,
596, 81, 227, 603, 492, 1199, 1214, 2831, 96
};
static double[] ticks = {0.001, 0.005, 0.01, 0.02, 0.05, 0.10, 0.20, 0.30,
0.40, 0.50, 0.60, 0.70, 0.80, 0.90, 0.95, 0.98,
0.99, 0.995, 0.999
};
public SampleCumulativeProbability() {
Chart chart = this.Chart;
AxisXY axis = new AxisXY(chart);
double a = ticks[0];
double b = ticks[ticks.Length-1];
chart.ChartTitle.SetTitle(“Normal Probability Plot”);
axis.AxisX.AxisTitle.SetTitle(“Transformed Time between failures”);
axis.AxisY.AxisTitle.SetTitle(“Cummulative Probability”);
axis.AxisY.Transform = Axis.TRANSFORM_CUSTOM;
Transform transform = new NormalTransform();
axis.AxisY.CustomTransform = transform;
axis.AxisY.AutoscaleInput = Axis.AUTOSCALE_OFF;
axis.AxisY.SetWindow(a, b);
axis.AxisY.TextFormat = “P1”;
axis.AxisY.SetTicks(ticks);
axis.AxisY.MinorTick.IsVisible = false;
int n = timeBetweenFailures.Length;
double[] x = new double[n];
double[] y = new double[n];
for (int i = 0; i < x.Length; i++) {
x[i] = System.Math.Pow(timeBetweenFailures[i], 1.0/3.6);
}
Sort.Ascending(x);
for (int i = 0; i < x.Length; i++) {
y[i] = (double)(i+0.5) / (double)n;
}
Data data = new Data(axis, x, y);
data.DataType = Data.DATA_TYPE_MARKER;
data.MarkerType = Data.MARKER_TYPE_FILLED_CIRCLE;
// Compute an plot a regresssion line
LinearRegression lr = new LinearRegression(1, true);
for (int i = 0; i < n; i++) {
lr.Update(new double[]{x[i]}, Cdf.InverseNormal(y[i]));
}
double[] coef = lr.GetCoefficients();
double[] lry = new double[x.Length];
for (int i = 0; i < x.Length; i++) {
lry[i] = Cdf.Normal(coef[0]+coef[1]*x[i]);
}
Data lrData = new Data(axis, x, lry);
lrData.DataType = Data.DATA_TYPE_LINE;
lrData.LineColor = System.Drawing.Color.Blue;
}
public static void Main(string[] argv) {
System.Windows.Forms.Application.Run(new SampleCumulativeProbability());
}
}
class NormalTransform : Transform {
private double scaleA, scaleB;
// Initializes the mappings between user and coordinate space.
public void SetupMapping(Axis1D axis1d) {
double[] w = axis1d.GetWindow();
double t = Cdf.InverseNormal(w[0]);
scaleB = 1.0 / (Cdf.InverseNormal(w[1]) - t);
scaleA = -scaleB * t;
}
// Maps a point in [0,1] to a probability.
public double MapUnitToUser(double unit) {
return Cdf.Normal((unit - scaleA) / scaleB);
}
// Maps a probablity to the interval [0,1].
public double MapUserToUnit(double p) {
return scaleA + scaleB * Cdf.InverseNormal(p);
}
}

| © Visual Numerics, Inc. All rights reserved. |


|