IMSL C# Programmer’s Guide


IMSL C# Programmer’s Guide
|
Charting 2D Types >> Dendrogram Chart |
|
Dendrogram Chart
A dendrogram chart is a graphical way to display results from hierarchical cluster analysis. This section describes the construction of a dendrogram chart.
Example
The data for this example is grouped into clusters using the Dissimilarities
and ClusterHierarchical classes. A Dendrogram node is then created as
a child of an axis node. The Dendrogram constructor requires input values from
the ClusterHierarchical object.
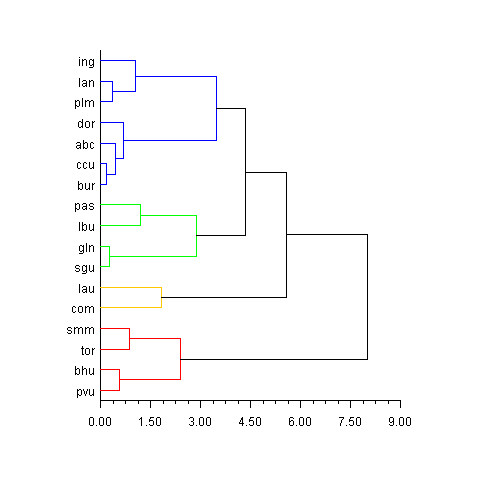
The SetLables and SetLineColor methods are used to customize the look
of the chart. Labels are provided in a String array in the order of the input data
and sorted by the Dendrogram object to match the output order. Clusters are
grouped by color based on the number of elements in the array passed to the
SetLineColor method.
(Download Code)
using Imsl.Chart2D;
using Imsl.Stat;
using System.Drawing;

public class SampleDendrogram : FrameChart {

    public SampleDendrogram() {
        /*
        1998 test data from 17 school districts in Los Angeles County.

        The variables were:
        lep - Proportion of LEP students to total tested
        read - The Reading Scaled Score for 5th Grade
        math - The Math Scaled Score for 5th Grade
        lang - The Language Scaled Score for 5th Grade

        The districts were:
        lau - Los Angeles
        ccu - Culver City
        bhu - Beverly Hills
        ing - Inglewood
        com - Compton
        smm - Santa Monica Malibu
        bur - Burbank
        gln - Glendale
        pvu - Palos Verdes
        sgu - San Gabriel
        abc - Artesia, Bloomfield, and Carmenita
        pas - Pasadena
        lan - Lancaster
        plm - Palmdale
        tor - Torrance
        dow - Downey
        lbu - Long Beach

        input lep read math lang str3 district
        .38 626.5 601.3 605.3 lau
        .18 654.0 647.1 641.8 ccu
        .07 677.2 676.5 670.5 bhu
        .09 639.9 640.3 636.0 ing
        .19 614.7 617.3 606.2 com
        .12 670.2 666.0 659.3 smm
        .20 651.1 645.2 643.4 bur
        .41 645.4 645.8 644.8 gln
        .07 683.5 682.9 674.3 pvu
        .39 648.6 647.8 643.1 sgu
        .21 650.4 650.8 643.9 abc
        .24 637.0 636.9 626.5 pas
        .09 641.1 628.8 629.4 lan
        .12 638.0 627.7 628.6 plm
        .11 661.4 659.0 651.8 tor
        .22 646.4 646.2 647.0 dow
        .33 634.1 632.0 627.8 lbu
        */

        double[,] data = {
            {.38, 626.5, 601.3, 605.3},
            {.18, 654.0, 647.1, 641.8},
            {.07, 677.2, 676.5, 670.5},
            {.09, 639.9, 640.3, 636.0},
            {.19, 614.7, 617.3, 606.2},
            {.12, 670.2, 666.0, 659.3},
            {.20, 651.1, 645.2, 643.4},
            {.41, 645.4, 645.8, 644.8},
            {.07, 683.5, 682.9, 674.3},
            {.39, 648.6, 647.8, 643.1},
            {.21, 650.4, 650.8, 643.9},
            {.24, 637.0, 636.9, 626.5},
            {.09, 641.1, 628.8, 629.4},
            {.12, 638.0, 627.7, 628.6},
            {.11, 661.4, 659.0, 651.8},
            {.22, 646.4, 646.2, 647.0},
            {.33, 634.1, 632.0, 627.8}};

        string[] lab = {“lau”, “ccu”, “bhu”, “ing”, “com”, “smm”,
                        “bur”, “gln”, “pvu”, “sgu”, “abc”, “pas”,
                        “lan”, “plm”, “tor”, “dor”, “lbu”};


	 	 // 3rd arg in Dissimilarities gives different results for 0,1,2
	 	 Dissimilarities dist = new Dissimilarities(data, 0, 1, 1);
	 	 ClusterHierarchical clink =
            new ClusterHierarchical(dist.DistanceMatrix, 4, 0);

	 	 int nClusters = 4;
	 	 int[] iclus = clink.GetClusterMembership(nClusters);
	 	 int[] nclus = clink.GetObsPerCluster(nClusters);

	 	 Chart chart = this.Chart;
	 	 AxisXY axis = new AxisXY(chart);

	 	 // use either method below to create the chart
	 	 Dendrogram dc =
            new Dendrogram(axis, clink, Data.DENDROGRAM_TYPE_HORIZONTAL);
        /*
            new Dendrogram(axis, clink.getClusterLevel(),
                clink.getClusterLeftSons(), clink.getClusterRightSons(),
                Data.DENDROGRAM_TYPE_HORIZONTAL);
	 	 */
	 	 dc.SetLabels(lab);
	 	 dc.SetLineColors(
            new Color[]{Color.Blue, Color.Green, Color.Red, Color.Orange});
    }

    public static void Main(string[] argv) {
        System.Windows.Forms.Application.Run(new SampleDendrogram());
    }
}
| © Visual Numerics, Inc. All rights reserved. |
|