IMSL C# Programmer’s Guide


IMSL C# Programmer’s Guide
|
Charting 2D Types >> Function Plot |
|
Function Plot
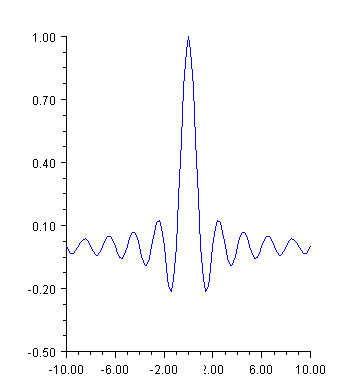
A function plot shows the value of a function f(x) over an interval [a,b]. The function
must be defined as an implementation of the ChartFunction interface. A
Data node constructor creates a line chart from the function. The look of the function
is controlled by the line attributes.
The ChartFunction interface requires that the function name be "F", that the
function has a single double argument and that it returns a double.
Example
This example plots the sinc function on the interval [-10,10]. The sinc function is
defined to be sin(px)/px. In this example, Sinc is a class that implements
ChartFunction. This is required by the function Data constructor. In the code,
the case x=0 is handled specially to avoid returning NaN.
(Download Code)
using Imsl.Chart2D;
using System;
using System.Drawing;

public class SampleFunction : FrameChart {

    public SampleFunction() {
        Chart chart = this.Chart;
        AxisXY axis = new AxisXY(chart);

        Data data = new Data(axis, new sinc(), -10.0, 10.0);
        data.LineColor = Color.Blue;
    }

    public static void Main(string[] argv) {
        System.Windows.Forms.Application.Run(new SampleFunction());
    }
}

class sinc : ChartFunction {
    public double F(double x) {
        if (x == 0.0) return 1.0;
        return Math.Sin(Math.PI*x) / (Math.PI*x);
    }
}
Histogram Example
For another example of a ChartFunction, see Histogram.
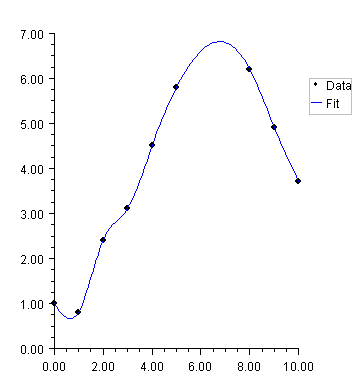
Spline Chart
This example shows raw data points, as markers, and their fit to a shape preserving
spline. The spline is computed using CsShape found in the IMSL C# Math package
(which extends Spline). The ChartSpline class wraps the Spline into
a ChartFunction. This example also enables the Legend.
using Imsl.Chart2D;
using Imsl.Math;
using System.Drawing;

public class SampleSpline : FrameChart {

    public SampleSpline() {
        Chart chart = this.Chart;
        AxisXY axis = new AxisXY(chart);
        chart.Legend.IsVisible = true;

        double[] x = {0, 1, 2, 3, 4, 5, 8, 9, 10};
        double[] y = {1.0, 0.8, 2.4, 3.1, 4.5, 5.8, 6.2, 4.9, 3.7};
        Data dataMarker = new Data(axis, x, y);
        dataMarker.SetTitle(“Data”);
        dataMarker.DataType = Data.DATA_TYPE_MARKER;
        dataMarker.MarkerType = Data.MARKER_TYPE_FILLED_CIRCLE;

        CsShape spline = new CsShape(x, y);
        Data dataSpline = new Data(axis, new ChartSpline(spline), 0.0, 10.0);
        dataSpline.SetTitle(“Fit”);
        dataSpline.LineColor = Color.Blue;
    }

    public static void Main(string[] argv) {
        System.Windows.Forms.Application.Run(new SampleSpline());
    }
}
| © Visual Numerics, Inc. All rights reserved. |
|