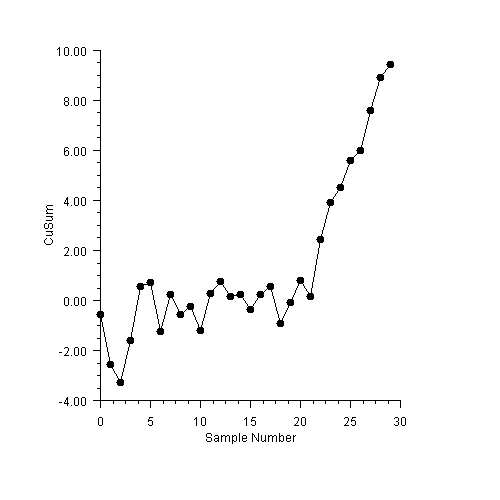
CuSum is the cumulative
sum control chart. It plots the cumulative sum of the deviations of the
expected value. If  is the expected mean
for a process and
  are the sample means
then the cumulative sum is

CuSum Example
The data used is the same as for the EWMA example.

using Imsl.Chart2D;
using Imsl.Chart2D.QC;
public class SampleCuSum : FrameChart {
static double[] data = {
9.45, 7.99, 9.29, 11.66, 12.16, 10.18, 8.04, 11.46, 9.20, 10.34, 9.03,
11.47, 10.51, 9.40, 10.08, 9.37, 10.62, 10.31, 8.52, 10.84, 10.90,
9.33, 12.29, 11.50, 10.60, 11.08, 10.38, 11.62, 11.31, 10.52
};
public SampleCuSum() {
Chart chart = this.Chart;
AxisXY axis = new AxisXY(chart);
CuSum cusum = new CuSum(axis, data);
cusum.ExpectedMean = 10.0;
axis.AxisX.AxisTitle.SetTitle("Sample Number");
axis.AxisX.AxisLabel.TextFormat = "0";
axis.AxisY.AxisTitle.SetTitle("CuSum");
}
public static void Main(string[] argv) {
System.Windows.Forms.Application.Run(new SampleCuSum());
}
}
|
PHONE: 713.784.3131 FAX:713.781.9260 |