CuSumStatus
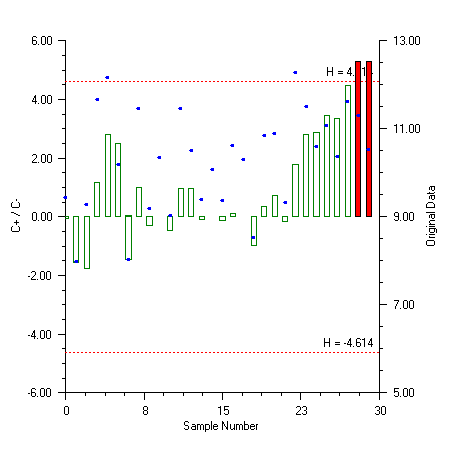
CuSumStatus is a tabular or status CuSum chart. The tabular CuSum statistics are


By default, both statistics have initial value zero. The
parameter K is the slack value (or allowance or reference value) and
 is the expected
mean.
The CuSumStatus
chart contains two bar charts: a bar chart of  above the x-axis and a bar chart of
  below the x-axis. There are also control limits at
plus and minus H. The value of H can be set either as an absolute
value or as a relative value h. They are related by
 , where
  is the standard deviation. By default, bars which are
out-of-control are filled red while in-control bars are green. The data is also
plotted on the chart.
The CuSumStatus
has a Print
method to print the  and
and  values as well as
  and
and  , where
  is the number of consecutive periods since
  rose above zero.
CuSumStatus Example
This example uses the same data as used for the CuSum and EWMA examples. In this example  .
.

using Imsl.Chart2D;
using Imsl.Chart2D.QC;
using System.Drawing;
public class SampleCuSumStatus : FrameChart {
static double[] data = {
9.45, 7.99, 9.29, 11.66, 12.16, 10.18, 8.04, 11.46,
9.20, 10.34, 9.03, 11.47, 10.51, 9.40, 10.08, 9.37,
10.62, 10.31, 8.52, 10.84, 10.90, 9.33, 12.29, 11.50,
10.60, 11.08, 10.38, 11.62, 11.31, 10.52
};
public SampleCuSumStatus() {
double expectedMean = 10;
double slackValue = 0.5;
Chart chart = this.Chart;
AxisXY axis = new AxisXY(chart);
CuSumStatus cusumStatus =
new CuSumStatus(axis, data, expectedMean, slackValue);
cusumStatus.RelativeH = 4;
cusumStatus.Print();
axis.AxisX.AxisTitle.SetTitle("Sample Number");
axis.AxisX.AxisLabel.TextFormat = "0";
axis.AxisY.AxisTitle.SetTitle("C+ / C-");
axis.AxisX.SetWindow(0, 30);
axis.AxisX.AutoscaleInput = 0;
cusumStatus.AddDataMarkers();
cusumStatus.DataMarkers.MarkerSize = 0.5;
cusumStatus.DataMarkers.MarkerColor = Color.Blue;
cusumStatus.DataMarkersAxis.AxisY.AxisTitle.SetTitle(
"Original Data");
cusumStatus.BarPlus.GetBarSet(0,0).FillType =
Data.FILL_TYPE_NONE;
cusumStatus.BarMinus.GetBarSet(0,0).FillType =
Data.FILL_TYPE_NONE;
cusumStatus.BarPlus.GetBarSet(0,0).FillOutlineColor =
Color.Green;
cusumStatus.BarMinus.GetBarSet(0,0).FillOutlineColor =
Color.Green;
}
public static void Main(string[] argv) {
System.Windows.Forms.Application.Run(new SampleCuSumStatus());
}
}
|
PHONE: 713.784.3131 FAX:713.781.9260 |