A Heatmap divides a rectangle into subrectangles. The color of each subrectangle is determined by the value of a data array and a colormap.
If the data array is m by n then there are m divisions along the x-axis and n divisions along the y-axis.
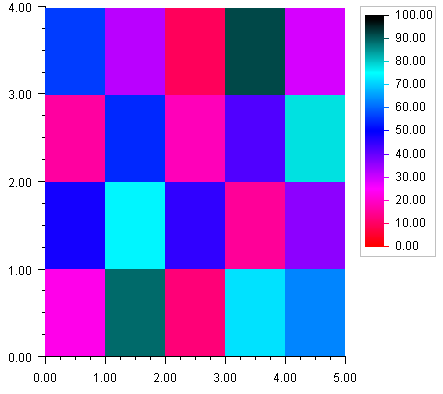
A Colormap is a mapping from [0,1] to color values. The blue-red colormap, used in the example below, maps 0 to red and 1 to dark blue and interpolates between these endpoints values. The heatmap maps the minimum data value to the color corresponding to 0 and the highest data value to the color corresponding to 1.
The Heatmap class has a special legend for colormaps. It displays the color values as a gradient labeled with corresponding data values.
Example
In this example a two-dimensional array of data is plotted as a heatmap. The “red-blue” Colormap is used. The HeatmapLegend is enabled by setting its IsVisible property to true.
using Imsl.Chart2D;
public class SampleHeatmap : FrameChart {
public SampleHeatmap() {
Chart chart = this.Chart;
AxisXY axis = new AxisXY(chart);
double xmin = 0.0;
double xmax = 5.0;
double ymin = 0.0;
double ymax = 4.0;
double zmin = 0.0;
double zmax = 100.0;
double[,] data = new double [,] {
{23, 48, 16, 56},
{89, 74, 54, 32},
{12, 45, 18, 9},
{72, 15, 42, 92},
{63, 36, 78, 29}
};
Heatmap heatmap = new Heatmap(axis, xmin, xmax, ymin, ymax,
zmin, zmax, data, Colormap_Fields.BLUE_RED);
heatmap.HeatmapLegend.IsVisible = true;
}
public static void Main(string[] argv) {
System.Windows.Forms.Application.Run(new SampleHeatmap());
}
}
|
PHONE: 713.784.3131 FAX:713.781.9260 |