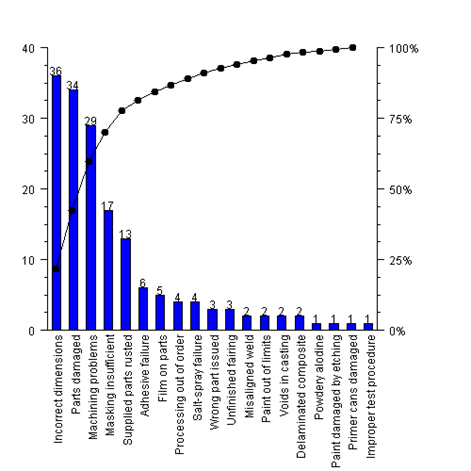
A ParetoChart is a frequency distribution of attribute data. The bars are ordered by the number of defects, with the attribute category having the largest number of defects appearing first.
There is an option to add a cumulative percentage line to the chart. This is the percent of defects accounted for by the current item and all items to its left. If the cumulative percentage line is added, a second axis is created on the right representing the cumulative percentage from 0% to 100%. The units of the original axis, which always appear on the left, represent the number of defects, 36.
ParetoChart Example
The number of defects attributable to 1 of 19 of a variety of causes was collected (Montgomery 179). In this example, the “Incorrect dimensions” defect category has the largest number of defects, 36.
using Imsl.Chart2D;
using Imsl.Chart2D.QC;
public class SampleParetoChart : FrameChart {
static string[] labels = {
"Parts damaged",
"Machining problems",
"Supplied parts rusted",
"Masking insufficient",
"Misaligned weld",
"Processing out of order",
"Wrong part issued",
"Unfinished fairing",
"Adhesive failure",
"Powdery alodine",
"Paint out of limits",
"Paint damaged by etching",
"Film on parts",
"Primer cans damaged",
"Voids in casting",
"Delaminated composite",
"Incorrect dimensions",
"Improper test procedure",
"Salt-spray failure"
};
static int[] numberDefects = {
34, 29, 13, 17, 2, 4, 3, 3, 6,
1, 2, 1, 5, 1, 2, 2, 36, 1, 4
};
public SampleParetoChart() {
Chart chart = this.Chart;
AxisXY axis = new AxisXY(chart);
ParetoChart pareto = new ParetoChart(axis, labels, numberDefects);
Data cumulativeLine = pareto.AddCumulativeLine();
cumulativeLine.MarkerType = Data.MARKER_TYPE_FILLED_CIRCLE;
pareto.LabelType = ParetoChart.LABEL_TYPE_Y;
pareto.TextFormat = "0";
pareto.FillColor = System.Drawing.Color.Blue;
axis.AxisX.AxisLabel.TextAngle = 90;
double[] vp = axis.GetViewport();
vp[0] = 0.1;
vp[3] = 0.7;
axis.SetViewport(vp);
cumulativeLine.Axis.SetViewport(vp);
}
public static void Main(string[] argv) {
System.Windows.Forms.Application.Run(new SampleParetoChart());
}
}
|
PHONE: 713.784.3131 FAX:713.781.9260 |