-
- All Implemented Interfaces:
- Serializable, Cloneable
public class XbarR
extends ShewhartControlChart
XbarRis an X-bar chart for monitoring a process using sample ranges.The control limits are at
where
 is the grand mean of all of the observations,
 is the mean of the observed ranges,
n is the sample size,
and k is the value of the "ControlLimit" attribute for the limit.
Additionally,
is the mean of the observed ranges,
n is the sample size,
and k is the value of the "ControlLimit" attribute for the limit.
Additionally,
![d_{2,n}=E[R]/sigma](eqn_0035.png) , where R is the range of
data from a Gaussian distribution.
Therefore
, where R is the range of
data from a Gaussian distribution.
Therefore  is an estimate of the within sample standard deviation.
By default, the chart contains
an upper control limit with k=3,
a lower control limit with k=-3,
and a central line equal to
is an estimate of the within sample standard deviation.
By default, the chart contains
an upper control limit with k=3,
a lower control limit with k=-3,
and a central line equal to  .
Additional control limits can be added.
The method
.
Additional control limits can be added.
The method addWecoadds control limits with k = -2, -1, 1, 2.
-
-
Field Summary
-
Fields inherited from class com.imsl.chart.qc.ShewhartControlChart
d2, d3
-
Fields inherited from class com.imsl.chart.ChartNode
AXIS_X_TOP, AXIS_Y_RIGHT, BAR_TYPE_HORIZONTAL, BAR_TYPE_VERTICAL, DASH_PATTERN_DASH, DASH_PATTERN_DASH_DOT, DASH_PATTERN_DOT, DASH_PATTERN_SOLID, DATA_TYPE_FILL, DATA_TYPE_LINE, DATA_TYPE_MARKER, DATA_TYPE_PICTURE, DATA_TYPE_TUBE, DENDROGRAM_TYPE_HORIZONTAL, DENDROGRAM_TYPE_VERTICAL, FILL_TYPE_GRADIENT, FILL_TYPE_NONE, FILL_TYPE_PAINT, FILL_TYPE_SOLID, LABEL_TYPE_PERCENT, MARKER_TYPE_ASTERISK, MARKER_TYPE_CIRCLE_CIRCLE, MARKER_TYPE_CIRCLE_PLUS, MARKER_TYPE_CIRCLE_X, MARKER_TYPE_DIAMOND_PLUS, MARKER_TYPE_FILLED_CIRCLE, MARKER_TYPE_FILLED_DIAMOND, MARKER_TYPE_FILLED_SQUARE, MARKER_TYPE_FILLED_TRIANGLE, MARKER_TYPE_HOLLOW_CIRCLE, MARKER_TYPE_HOLLOW_DIAMOND, MARKER_TYPE_HOLLOW_SQUARE, MARKER_TYPE_HOLLOW_TRIANGLE, MARKER_TYPE_OCTAGON_PLUS, MARKER_TYPE_OCTAGON_X, MARKER_TYPE_PLUS, MARKER_TYPE_SQUARE_PLUS, MARKER_TYPE_SQUARE_X, MARKER_TYPE_X, TEXT_X_CENTER, TEXT_X_LEFT, TEXT_X_RIGHT, TEXT_Y_BOTTOM, TEXT_Y_CENTER, TEXT_Y_TOP
-
Fields inherited from class com.imsl.chart.AbstractChartNode
AUTOSCALE_DATA, AUTOSCALE_DENSITY, AUTOSCALE_NUMBER, AUTOSCALE_OFF, AUTOSCALE_WINDOW, AXIS_X, AXIS_Y, AXIS_Z, LABEL_TYPE_NONE, LABEL_TYPE_TITLE, LABEL_TYPE_X, LABEL_TYPE_Y, LABEL_TYPE_Z, TRANSFORM_CUSTOM, TRANSFORM_LINEAR, TRANSFORM_LOG
-
-
Constructor Summary
Constructors Constructor and Description XbarR(AxisXY axis, double[][] x)Creates an X-bar chart from sample data using sample ranges.XbarR(AxisXY axis, int[] sampleSize, double[] xbar, double[] range)Creates an X-bar control chart given the means and ranges for a series of unequally sized samples.XbarR(AxisXY axis, int sampleSize, double[] xbar, double[] range)Creates an X-bar control chart given the means and ranges for a series of equally sized samples.
-
Method Summary
Methods Modifier and Type Method and Description doublecapabilityIndexCp(double lowerSpecificationLimit, double upperSpecificationLimit)Returns the capability index
doublecapabilityIndexCpk(double lowerSpecificationLimit, double upperSpecificationLimit)Returns the capability index
![c_{pk}=minleft[frac{mathrm{USL}-bar{x}}{3sigma},frac{bar{x}-mathrm{LSL}}{3sigma}right]](eqn_0042.png)
static ShewhartControlChart[]createCharts(Chart chart, double[][] x)Creates a combinedXbarRchart andRChartfrom data.static ShewhartControlChart[]createCharts(Chart chart, int[] sampleSize, double[] xbar, double[] range)Creates a combinedXbarRchart andRChartgiven the means and ranges for a series of unequally sized samples.static ShewhartControlChart[]createCharts(Chart chart, int sampleSize, double[] xbar, double[] range)Creates a combinedXbarRchart andRChartgiven the means and ranges for a series of equally sized samples.doublegetRbar()Returns the value of the "Rbar" attribute, the mean of the ranges for a series of samples.voidprePaint()Setup chart with current settings.voidsetRbar(double rbar)Sets the value of the "Rbar" attribute, the mean of the ranges for a series of samples.-
Methods inherited from class com.imsl.chart.qc.ShewhartControlChart
addCenterLine, addControlLimit, addLowerControlLimit, addUpperControlLimit, addWecoLimits, dataRange, getCenter, getCenterLine, getControlData, getLowerControlLimit, getMeanSampleSize, getSampleSize, getUpperControlLimit, paint, removeControlLimit, setCenter, setData, setData, setSampleSize, setSampleSize, setX
-
Methods inherited from class com.imsl.chart.Data
formatLabel
-
Methods inherited from class com.imsl.chart.ChartNode
addPickListener, firePickListeners, getALT, getAxis, getBackground, getBarGap, getBarType, getBarWidth, getChart, getChartTitle, getChildren, getClipData, getComponent, getConcatenatedViewport, getDataType, getDoubleBuffering, getExplode, getFillOutlineColor, getFillOutlineType, getFillPaint, getFillType, getGradient, getHREF, getLegend, getLineDashPattern, getMarkerDashPattern, getMarkerThickness, getMarkerType, getParent, getReference, getScreenAxis, getScreenSize, getScreenViewport, getSize, getSkipWeekends, getTextAngle, getTextColor, getTitle, getToolTip, getViewport, isBitSet, removePickListener, setALT, setBarGap, setBarType, setBarWidth, setChartTitle, setClipData, setCustomTransform, setDataType, setDoubleBuffering, setExplode, setFillOutlineColor, setFillOutlineColor, setFillOutlineType, setFillPaint, setFillPaint, setFillPaint, setFillType, setGradient, setGradient, setGradient, setHREF, setImage, setLineDashPattern, setMarkerDashPattern, setMarkerThickness, setMarkerType, setReference, setScreenSize, setSize, setSkipWeekends, setTextAngle, setTextColor, setTextColor, setTitle, setTitle, setToolTip, setViewport, setViewport
-
Methods inherited from class com.imsl.chart.AbstractChartNode
clone, clone, clone, clone, getAbstractParent, getAttribute, getAutoscaleInput, getAutoscaleMinimumTimeInterval, getAutoscaleOutput, getBooleanAttribute, getChildList, getColorAttribute, getCustomTransform, getDensity, getDoubleAttribute, getFillColor, getFont, getFontName, getFontSize, getFontStyle, getImage, getIntegerAttribute, getLabelType, getLightColor, getLineColor, getLineWidth, getLocale, getMarkerColor, getMarkerSize, getName, getNumber, getPaint, getStringAttribute, getTextFormat, getTickLength, getTransform, getX, getY, isAncestorOf, isAttributeSet, isAttributeSetAtThisNode, parseColor, remove, setAttribute, setAutoscaleInput, setAutoscaleMinimumTimeInterval, setAutoscaleOutput, setDensity, setFillColor, setFillColor, setFont, setFontName, setFontSize, setFontStyle, setImage, setLabelType, setLightColor, setLightColor, setLineColor, setLineColor, setLineWidth, setLocale, setMarkerColor, setMarkerColor, setMarkerSize, setName, setNumber, setPaint, setTextFormat, setTextFormat, setTickLength, setTransform, setX, setY, toString
-
-
-
-
Constructor Detail
-
XbarR
public XbarR(AxisXY axis,
     double[][] x)
Creates an X-bar chart from sample data using sample ranges.- Parameters:
axis- theAxisXYparent of this node.x- is an array of arrays containing sample data. The data of the i-th sample is inx[i]. Each row must have between 2 and 50 entries.
-
XbarR
public XbarR(AxisXY axis,
     int[] sampleSize,
     double[] xbar,
     double[] range)
Creates an X-bar control chart given the means and ranges for a series of unequally sized samples.- Parameters:
axis- theAxisXYparent of this nodesampleSize- is an array containing the nuumber of observations in each sample. Each sample must contain between 2 and 50 observations.xbar- is an array containing the mean values for a series of samples.range- is an array containing the ranges of the samples.
-
XbarR
public XbarR(AxisXY axis,
     int sampleSize,
     double[] xbar,
     double[] range)
Creates an X-bar control chart given the means and ranges for a series of equally sized samples.- Parameters:
axis- theAxisXYparent of this nodesampleSize- is the number of observations in each sample. It must be between 2 and 50.xbar- is an array containing the mean values for a series of samples.range- is an array containing the ranges of the samples. The arraysxbarandrangemust have the same lengths.
-
-
Method Detail
-
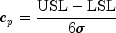
capabilityIndexCp
public double capabilityIndexCp(double lowerSpecificationLimit,
                       double upperSpecificationLimit)
Returns the capability index
where LSL and USL are the lower and upper specification limits and
.
- Parameters:
lowerSpecificationLimit- is the lower specification limit.upperSpecificationLimit- is the upper specification limit.- Returns:
- the capability index.
-
capabilityIndexCpk
public double capabilityIndexCpk(double lowerSpecificationLimit,
                        double upperSpecificationLimit)
Returns the capability index
where LSL and USL are the lower and upper specification limits, is the center line, and
.
- Parameters:
lowerSpecificationLimit- is the lower specification limit.upperSpecificationLimit- is the upper specification limit.- Returns:
- the capability index.
-
createCharts
public static ShewhartControlChart[] createCharts(Chart chart,
                                  double[][] x)
Creates a combinedXbarRchart andRChartfrom data. The viewport of theXbarRchart is [0.2, 0.9] by [0.1, 0.4]. The viewport of theRChartchart is [0.2, 0.9] by [0.5, 0.8].- Parameters:
chart- is theChartobject which is the parent of the two charts being created.x- is an array of arrays containing sample data. The data of the i-th sample is inx[i]. Each sample must contain at least 2 and no more than 50 observations.- Returns:
- an array of length two containing the XBarR chart and the
RChart.
-
createCharts
public static ShewhartControlChart[] createCharts(Chart chart,
                                  int[] sampleSize,
                                  double[] xbar,
                                  double[] range)
Creates a combinedXbarRchart andRChartgiven the means and ranges for a series of unequally sized samples. The viewport of theXbarRchart is [0.2, 0.9] by [0.1, 0.4]. The viewport of theRChartchart is [0.2, 0.9] by [0.5, 0.8].- Parameters:
chart- is theChartobject which is the parent of the two charts being created.sampleSize- is an array containing the number of observations in each sample. Each sample must have between 2 and 50 observations.xbar- is an array containing the mean values for a series of samples.range- is an array containing the ranges of the samples.- Returns:
- an array of length two containing the XBarR chart and the
RChart.
-
createCharts
public static ShewhartControlChart[] createCharts(Chart chart,
                                  int sampleSize,
                                  double[] xbar,
                                  double[] range)
Creates a combinedXbarRchart andRChartgiven the means and ranges for a series of equally sized samples. The viewport of theXbarRchart is [0.2, 0.9] by [0.1, 0.4]. The viewport of theRChartchart is [0.2, 0.9] by [0.5, 0.8].- Parameters:
chart- is theChartobject which is the parent of the two charts being created.sampleSize- is the number of observations in each sample. It must be between 2 and 50.xbar- is an array containing the mean values for a series of samples.range- is an array containing the ranges of the samples.- Returns:
- an array of length two containing the XBarR chart and the
RChart.
-
getRbar
public double getRbar()
Returns the value of the "Rbar" attribute, the mean of the ranges for a series of samples.- Returns:
- the mean of the ranges for a series of samples
-
prePaint
public void prePaint()
Setup chart with current settings.
-
setRbar
public void setRbar(double rbar)
Sets the value of the "Rbar" attribute, the mean of the ranges for a series of samples.- Parameters:
rbar- is the mean of the ranges for a series of samples.
-
-