-
- All Implemented Interfaces:
- Serializable, Cloneable
public class XbarS
extends ShewhartControlChart
XbarSis an X-bar chart for monitoring a process using sample standard deviations.The control limits are at
where
 is the grand mean of all of the observations,
n is the sample size,
and k is the value of the "ControlLimit" attribute for the limit.
Additionally,
is the grand mean of all of the observations,
n is the sample size,
and k is the value of the "ControlLimit" attribute for the limit.
Additionally,  is a factor such that
 is an unbiased estimator of the within sample standard deviation.
By default, the chart contains
an upper control limit line with k=3,
a lower control limit line with k=-3,
and a central line equal to
is an unbiased estimator of the within sample standard deviation.
By default, the chart contains
an upper control limit line with k=3,
a lower control limit line with k=-3,
and a central line equal to  .
Additional control limit lines can be added.
The method
.
Additional control limit lines can be added.
The method addWecoadds control limits with k = -2, -1, 1, 2.
-
-
Field Summary
-
Fields inherited from class com.imsl.chart.qc.ShewhartControlChart
d2, d3
-
Fields inherited from class com.imsl.chart.ChartNode
AXIS_X_TOP, AXIS_Y_RIGHT, BAR_TYPE_HORIZONTAL, BAR_TYPE_VERTICAL, DASH_PATTERN_DASH, DASH_PATTERN_DASH_DOT, DASH_PATTERN_DOT, DASH_PATTERN_SOLID, DATA_TYPE_FILL, DATA_TYPE_LINE, DATA_TYPE_MARKER, DATA_TYPE_PICTURE, DATA_TYPE_TUBE, DENDROGRAM_TYPE_HORIZONTAL, DENDROGRAM_TYPE_VERTICAL, FILL_TYPE_GRADIENT, FILL_TYPE_NONE, FILL_TYPE_PAINT, FILL_TYPE_SOLID, LABEL_TYPE_PERCENT, MARKER_TYPE_ASTERISK, MARKER_TYPE_CIRCLE_CIRCLE, MARKER_TYPE_CIRCLE_PLUS, MARKER_TYPE_CIRCLE_X, MARKER_TYPE_DIAMOND_PLUS, MARKER_TYPE_FILLED_CIRCLE, MARKER_TYPE_FILLED_DIAMOND, MARKER_TYPE_FILLED_SQUARE, MARKER_TYPE_FILLED_TRIANGLE, MARKER_TYPE_HOLLOW_CIRCLE, MARKER_TYPE_HOLLOW_DIAMOND, MARKER_TYPE_HOLLOW_SQUARE, MARKER_TYPE_HOLLOW_TRIANGLE, MARKER_TYPE_OCTAGON_PLUS, MARKER_TYPE_OCTAGON_X, MARKER_TYPE_PLUS, MARKER_TYPE_SQUARE_PLUS, MARKER_TYPE_SQUARE_X, MARKER_TYPE_X, TEXT_X_CENTER, TEXT_X_LEFT, TEXT_X_RIGHT, TEXT_Y_BOTTOM, TEXT_Y_CENTER, TEXT_Y_TOP
-
Fields inherited from class com.imsl.chart.AbstractChartNode
AUTOSCALE_DATA, AUTOSCALE_DENSITY, AUTOSCALE_NUMBER, AUTOSCALE_OFF, AUTOSCALE_WINDOW, AXIS_X, AXIS_Y, AXIS_Z, LABEL_TYPE_NONE, LABEL_TYPE_TITLE, LABEL_TYPE_X, LABEL_TYPE_Y, LABEL_TYPE_Z, TRANSFORM_CUSTOM, TRANSFORM_LINEAR, TRANSFORM_LOG
-
-
Constructor Summary
Constructors Constructor and Description XbarS(AxisXY axis, double[][] x)Creates anXbarSchart from sample data using within sample standard deviations.XbarS(AxisXY axis, int[] sampleSize, double[] xbar, double[] w)Creates anXbarSchart given the means and standard deviations for a series of unequally sized samples.XbarS(AxisXY axis, int sampleSize, double[] xbar, double[] w)Creates anXbarSchart given the means and standard deviations for a series of equally sized samples.
-
Method Summary
Methods Modifier and Type Method and Description doublecapabilityIndexCp(double lowerSpecificationLimit, double upperSpecificationLimit)Returns the capability index
doublecapabilityIndexCpk(double lowerSpecificationLimit, double upperSpecificationLimit)Returns the capability index
![c_{pk}=minleft[frac{mathrm{USL}-bar{x}}{3sigma},frac{bar{x}-mathrm{LSL}}{3sigma}right]](eqn_0029.png)
static ShewhartControlChart[]createCharts(Chart chart, double[][] x)Creates a combinedXbarSchart andSChartfrom data.static ShewhartControlChart[]createCharts(Chart chart, int[] sampleSize, double[] xbar, double[] w)Creates a combined X-bar chart and S-chart given the means and in sample standard deviations for a series of unequally sized samples.static ShewhartControlChart[]createCharts(Chart chart, int sampleSize, double[] xbar, double[] w)Creates a combinedXbarSchart andSChartgiven the means and in sample standard deviations for a series of equally sized samples.doublegetWbar()Returns the value of the "Wbar" attribute, the within sample variation for a series of samples.voidprePaint()Setup chart with current settings.voidsetWbar(double wbar)Sets the value of the "Wbar" attribute, the within sample variation for a series of samples.-
Methods inherited from class com.imsl.chart.qc.ShewhartControlChart
addCenterLine, addControlLimit, addLowerControlLimit, addUpperControlLimit, addWecoLimits, dataRange, getCenter, getCenterLine, getControlData, getLowerControlLimit, getMeanSampleSize, getSampleSize, getUpperControlLimit, paint, removeControlLimit, setCenter, setData, setData, setSampleSize, setSampleSize, setX
-
Methods inherited from class com.imsl.chart.Data
formatLabel
-
Methods inherited from class com.imsl.chart.ChartNode
addPickListener, firePickListeners, getALT, getAxis, getBackground, getBarGap, getBarType, getBarWidth, getChart, getChartTitle, getChildren, getClipData, getComponent, getConcatenatedViewport, getDataType, getDoubleBuffering, getExplode, getFillOutlineColor, getFillOutlineType, getFillPaint, getFillType, getGradient, getHREF, getLegend, getLineDashPattern, getMarkerDashPattern, getMarkerThickness, getMarkerType, getParent, getReference, getScreenAxis, getScreenSize, getScreenViewport, getSize, getSkipWeekends, getTextAngle, getTextColor, getTitle, getToolTip, getViewport, isBitSet, removePickListener, setALT, setBarGap, setBarType, setBarWidth, setChartTitle, setClipData, setCustomTransform, setDataType, setDoubleBuffering, setExplode, setFillOutlineColor, setFillOutlineColor, setFillOutlineType, setFillPaint, setFillPaint, setFillPaint, setFillType, setGradient, setGradient, setGradient, setHREF, setImage, setLineDashPattern, setMarkerDashPattern, setMarkerThickness, setMarkerType, setReference, setScreenSize, setSize, setSkipWeekends, setTextAngle, setTextColor, setTextColor, setTitle, setTitle, setToolTip, setViewport, setViewport
-
Methods inherited from class com.imsl.chart.AbstractChartNode
clone, clone, clone, clone, getAbstractParent, getAttribute, getAutoscaleInput, getAutoscaleMinimumTimeInterval, getAutoscaleOutput, getBooleanAttribute, getChildList, getColorAttribute, getCustomTransform, getDensity, getDoubleAttribute, getFillColor, getFont, getFontName, getFontSize, getFontStyle, getImage, getIntegerAttribute, getLabelType, getLightColor, getLineColor, getLineWidth, getLocale, getMarkerColor, getMarkerSize, getName, getNumber, getPaint, getStringAttribute, getTextFormat, getTickLength, getTransform, getX, getY, isAncestorOf, isAttributeSet, isAttributeSetAtThisNode, parseColor, remove, setAttribute, setAutoscaleInput, setAutoscaleMinimumTimeInterval, setAutoscaleOutput, setDensity, setFillColor, setFillColor, setFont, setFontName, setFontSize, setFontStyle, setImage, setLabelType, setLightColor, setLightColor, setLineColor, setLineColor, setLineWidth, setLocale, setMarkerColor, setMarkerColor, setMarkerSize, setName, setNumber, setPaint, setTextFormat, setTextFormat, setTickLength, setTransform, setX, setY, toString
-
-
-
-
Constructor Detail
-
XbarS
public XbarS(AxisXY axis,
     double[][] x)
Creates anXbarSchart from sample data using within sample standard deviations.- Parameters:
axis- theAxisXYparent of this node.x- is an array of arrays containing sample data. The data of the i-th sample is inx[i]. Each row must have at least one entry.
-
XbarS
public XbarS(AxisXY axis,
     int[] sampleSize,
     double[] xbar,
     double[] w)
Creates anXbarSchart given the means and standard deviations for a series of unequally sized samples.- Parameters:
axis- theAxisXYparent of this nodesampleSize- is an array containing the number of observations in each sample. Each sample must have at least one observation.xbar- is an array containing the mean values for a series of samples.w- is an array containing the within sample variation for a series of samples.- Throws:
IllegalArgumentException- is thrown if the three input arrays do not all have the same length.
-
XbarS
public XbarS(AxisXY axis,
     int sampleSize,
     double[] xbar,
     double[] w)
Creates anXbarSchart given the means and standard deviations for a series of equally sized samples.- Parameters:
axis- theAxisXYparent of this nodesampleSize- is the number of observations in each sample. It must be at least one.xbar- is an array containing the mean values for a series of samples.w- is an array containing the within sample variation for a series of samples.- Throws:
IllegalArgumentException- is thrown if the two input arrays do not have the same length.
-
-
Method Detail
-
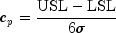
capabilityIndexCp
public double capabilityIndexCp(double lowerSpecificationLimit,
                       double upperSpecificationLimit)
Returns the capability index
where LSL and USL are the lower and upper specification limits and
.
- Parameters:
lowerSpecificationLimit- is the lower specification limit.upperSpecificationLimit- is the upper specification limit.- Returns:
- the capability index.
-
capabilityIndexCpk
public double capabilityIndexCpk(double lowerSpecificationLimit,
                        double upperSpecificationLimit)
Returns the capability index
where LSL and USL are the lower and upper specification limits, is the center line, and
.
- Parameters:
lowerSpecificationLimit- is the lower specification limit.upperSpecificationLimit- is the upper specification limit.- Returns:
- the capability index.
-
createCharts
public static ShewhartControlChart[] createCharts(Chart chart,
                                  double[][] x)
Creates a combinedXbarSchart andSChartfrom data. The viewport of theXbarSchart is [0.2, 0.9] by [0.1, 0.4]. The viewport of theSChartchart is [0.2, 0.9] by [0.5, 0.8].- Parameters:
chart- is theChartobject which is the parent of the two charts being created.x- is an array of arrays containing sample data. The data of the i-th sample is inx[i]. Each row must have at least one entry.- Returns:
- an array of length two containing the XBarS chart and the
SChart.
-
createCharts
public static ShewhartControlChart[] createCharts(Chart chart,
                                  int[] sampleSize,
                                  double[] xbar,
                                  double[] w)
Creates a combined X-bar chart and S-chart given the means and in sample standard deviations for a series of unequally sized samples.- Parameters:
chart- is theChartobject which is the parent of the two charts being created.xbar- is an array containing the mean values for a series of samples.sampleSize- is an array containing the number of observations in each sample. Each sample must have at least one observation.w- is an array containing the in sample standard deviations of the samples.- Returns:
- an array of length two containing the XBarS chart and the
SChart.
-
createCharts
public static ShewhartControlChart[] createCharts(Chart chart,
                                  int sampleSize,
                                  double[] xbar,
                                  double[] w)
Creates a combinedXbarSchart andSChartgiven the means and in sample standard deviations for a series of equally sized samples. The viewport of theXbarSchart is [0.2, 0.9] by [0.1, 0.4]. The viewport of theSChartchart is [0.2, 0.9] by [0.5, 0.8].- Parameters:
chart- is theChartobject which is the parent of the two charts being created.xbar- is an array containing the mean values for a series of samples.sampleSize- is the number of observations in each sample. It must be at least one.w- is an array containing the in sample standard deviations of the samples.- Returns:
- an array of length two containing the XBarS chart and the SChart.
-
getWbar
public double getWbar()
Returns the value of the "Wbar" attribute, the within sample variation for a series of samples. Its default value is set by the constructor to an estimate of the within sample variation- Returns:
- the within sample variation for a series of samples.
-
prePaint
public void prePaint()
Setup chart with current settings.
-
setWbar
public void setWbar(double wbar)
Sets the value of the "Wbar" attribute, the within sample variation for a series of samples. Its default value is set by the constructor to an estimate of the within sample variation.- Parameters:
wbar- is the within sample variation for a series of samples.
-
-