Chapter 8 Charting 3D Types
JMSL provides these 3D charting types:
Scatter Plot
This section describes the construction of scatter charts. The markers can be formatted using the
Marker Attributes.
It is also possible to mix lines, tubes, markers and surfaces on a single chart (see
Marker Attributes).
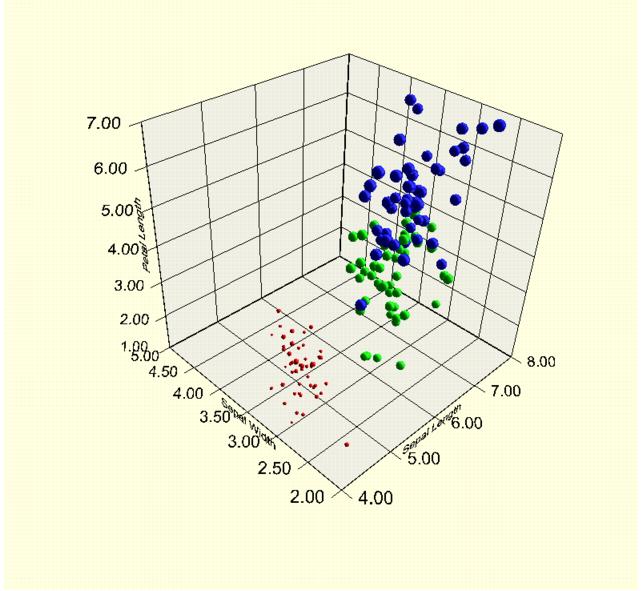
Fisher Iris Data
Fisher’s Iris data set is read from a flat file and is charted. Each observation in this data set has five values: species, sepal length, sepal width, petal length, and petal width. The sepal length is mapped into the x-coordinate, the sepal width is mapped to the y-coordinate, and the petal length is mapped into the z-coordinate. The petal width is mapped into the marker size. The species is mapped into the marker color.
import com.imsl.chart3d.*;
import com.imsl.io.FlatFile;
import java.awt.Color;
import java.io.*;
import java.sql.SQLException;
import java.util.StringTokenizer;
public class SampleFisherIris extends JFrameChart3D {
private int species[];
private double sepalLength[];
private double sepalWidth[];
private double petalLength[];
private double petalWidth[];
public SampleFisherIris() throws IOException, SQLException {
read();
Chart3D chart = getChart3D();
chart.getBackground().setFillColor("lightyellow");
AxisXYZ axis = new AxisXYZ(chart);
axis.setAxisTitlePosition(axis.AXIS_TITLE_PARALLEL);
axis.getAxisX().getAxisTitle().setTitle("Sepal Length");
axis.getAxisY().getAxisTitle().setTitle("Sepal Width");
axis.getAxisZ().getAxisTitle().setTitle("Petal Length");
axis.setDataType(Data.DATA_TYPE_MARKER);
axis.setMarkerType(Data.MARKER_TYPE_SPHERE);
Color color[] = {Color.red, Color.green, Color.blue};
for (int k = 0; k < species.length; k++) {
// marker type = Species
// x = Sepal Length
// y = Sepal Width
// z = Petal Length
// marker size = Petal Width
double xp[] = {sepalLength[k]};
double yp[] = {sepalWidth[k]};
double zp[] = {petalLength[k]};
Data data = new Data(axis, xp, yp, zp);
data.setMarkerSize(Math.sqrt(petalWidth[k]));
data.setMarkerColor(color[species[k]-1]);
}
setSize(800, 800);
render();
}
void read() throws IOException, SQLException {
InputStream is =
getClass().getResourceAsStream("FisherIris.csv");
FisherIrisReader fisherIrisReader =
new FisherIrisReader(is);
int nObs = 150;
species = new int[nObs];
sepalLength = new double[nObs];
sepalWidth = new double[nObs];
petalLength = new double[nObs];
petalWidth = new double[nObs];
for (int k = 0; fisherIrisReader.next(); k++) {
species[k] = fisherIrisReader.getInt("Species");
sepalLength[k] =
fisherIrisReader.getDouble("Sepal Length");
sepalWidth[k] =
fisherIrisReader.getDouble("Sepal Width");
petalLength[k] =
fisherIrisReader.getDouble("Petal Length");
petalWidth[k] =
fisherIrisReader.getDouble("Petal Width");
}
}
static private class FisherIrisReader extends FlatFile {
public FisherIrisReader(InputStream is)
throws IOException {
super(new BufferedReader(new InputStreamReader(is)));
String line = readLine();
StringTokenizer st = new StringTokenizer(line, ",");
for (int j = 0; st.hasMoreTokens(); j++) {
setColumnName(j+1, st.nextToken().trim());
setColumnClass(j, Double.class);
}
}
}
public static void main(String args[])
throws IOException, SQLException {
new SampleFisherIris().setVisible(true);
}
}