IMSL C# Programmer’s Guide


IMSL C# Programmer’s Guide
|
Quality Control and Improvement Charts >> CuSumStatus |
|
CuSumStatus
CuSumStatus is a tabular or status CuSum chart. The tabular CuSum statistics
are
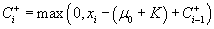
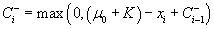
By default, both statistics have initial value zero. The parameter K is the slack value
(or allowance or reference value) and  is the expected mean.
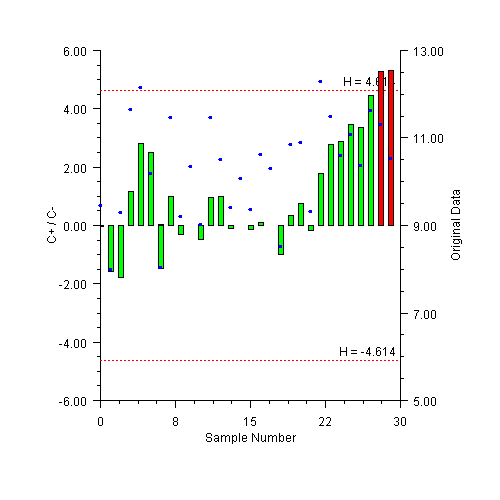
The CuSumStatus chart contains two bar charts: a bar chart of  above the x-
axis and a bar chart of
above the x-
axis and a bar chart of  below the x-axis. There are also control limits at plus and
minus H. The value of H can be set either as an absolute value or as a relative value
h. They are related by
below the x-axis. There are also control limits at plus and
minus H. The value of H can be set either as an absolute value or as a relative value
h. They are related by  , where
  is the standard deviation. By default, bars
which are out-of-control are filled red while in-control bars are green. The data is
also plotted on the chart.
is the standard deviation. By default, bars
which are out-of-control are filled red while in-control bars are green. The data is
also plotted on the chart.
The CuSumStatus has a Print method to print the  and
and  values as well
as
values as well
as  and
and  , where
  is the number of consecutive periods since
  rose above
zero.
rose above
zero.
CuSumStatus Example
This example uses the same data as used for the CuSum and EWMA examples. In
this example  .
.
using Imsl.Chart2D;
using Imsl.Chart2D.QC;
using System.Drawing;

public class SampleCuSumStatus : FrameChart {
    static double[] data = {
        9.45, 7.99, 9.29, 11.66, 12.16, 10.18, 8.04, 11.46, 9.20, 10.34, 9.03,
        11.47, 10.51, 9.40, 10.08, 9.37, 10.62, 10.31, 8.52, 10.84, 10.90,
        9.33, 12.29, 11.50, 10.60, 11.08, 10.38, 11.62, 11.31, 10.52
    };

    public SampleCuSumStatus() {
        double expectedMean = 10;
        double slackValue = 0.5;

        Chart chart = this.Chart;
        AxisXY axis = new AxisXY(chart);
        CuSumStatus cusumStatus =
            new CuSumStatus(axis, data, expectedMean, slackValue);
        cusumStatus.RelativeH = 4;
        cusumStatus.Print();

        axis.AxisX.AxisTitle.SetTitle(“Sample Number”);
        axis.AxisX.AxisLabel.TextFormat = “0”;
        axis.AxisY.AxisTitle.SetTitle(“C+ / C-”);

        axis.AxisX.SetWindow(0, 30);
        axis.AxisX.AutoscaleInput = 0;

        cusumStatus.AddDataMarkers();
        cusumStatus.DataMarkers.MarkerSize = 0.5;
        cusumStatus.DataMarkers.MarkerColor = Color.Blue;
        cusumStatus.DataMarkersAxis.AxisY.AxisTitle.SetTitle(“Original Data”);

        cusumStatus.BarPlus.GetBarSet(0,0).FillType = Data.FILL_TYPE_NONE;
	 	 cusumStatus.BarMinus.GetBarSet(0,0).FillType = Data.FILL_TYPE_NONE;
	 	 cusumStatus.BarPlus.GetBarSet(0,0).FillOutlineColor = Color.Green;
        cusumStatus.BarMinus.GetBarSet(0,0).FillOutlineColor = Color.Green;
    }

    public static void Main(string[] argv) {
        System.Windows.Forms.Application.Run(new SampleCuSumStatus());
    }
}
| © Visual Numerics, Inc. All rights reserved. |
|