IMSL C# Programmer’s Guide


IMSL C# Programmer’s Guide
|
Quality Control and Improvement Charts >> CuSum |
|
CuSum
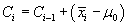
CuSum is the cumulative sum control chart. It plots the cumulative sum of the deviations
of the expected value. If  is the expected mean for a process and
  are the
sample means then the cumulative sum is
are the
sample means then the cumulative sum is
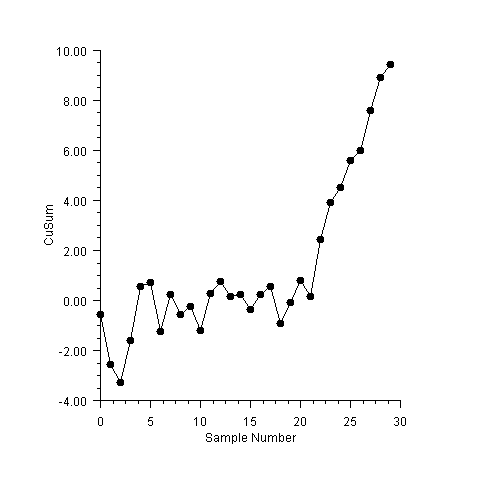
CuSum Example
The data used is the same as for the EWMA example.
using Imsl.Chart2D;
using Imsl.Chart2D.QC;

public class SampleCuSum : FrameChart {
    static double[] data = {
        9.45, 7.99, 9.29, 11.66, 12.16, 10.18, 8.04, 11.46, 9.20, 10.34, 9.03,
        11.47, 10.51, 9.40, 10.08, 9.37, 10.62, 10.31, 8.52, 10.84, 10.90,
        9.33, 12.29, 11.50, 10.60, 11.08, 10.38, 11.62, 11.31, 10.52
    };

    public SampleCuSum() {
        Chart chart = this.Chart;
        AxisXY axis = new AxisXY(chart);
        CuSum cusum = new CuSum(axis, data);
        cusum.ExpectedMean = 10.0;

        axis.AxisX.AxisTitle.SetTitle(“Sample Number”);
        axis.AxisX.AxisLabel.TextFormat = “0”;
        axis.AxisY.AxisTitle.SetTitle(“CuSum”);
    }

    public static void Main(string[] argv) {
        System.Windows.Forms.Application.Run(new SampleCuSum());
    }
}
| © Visual Numerics, Inc. All rights reserved. |
|