IMSL C# Programmer’s Guide


IMSL C# Programmer’s Guide
|
Quality Control and Improvement Charts >> EWMA |
|
EWMA
EWMA is the exponentially weighted moving average control chart. It is very effective in detecting small process shifts, but is slower than Shewhart charts at detecting large process shifts.
The exponentially weighted moving average is defined to be
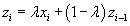
where  is a constant and the starting value is
  , the expected mean.
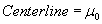
The control limits in EWMA are defined by the equations:
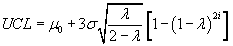
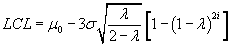
Where  is the historical mean,
  is the historical standard deviation, and i is the
sample number. Because of the presence of i the control limits are stair steps, not
constants.
is the historical standard deviation, and i is the
sample number. Because of the presence of i the control limits are stair steps, not
constants.
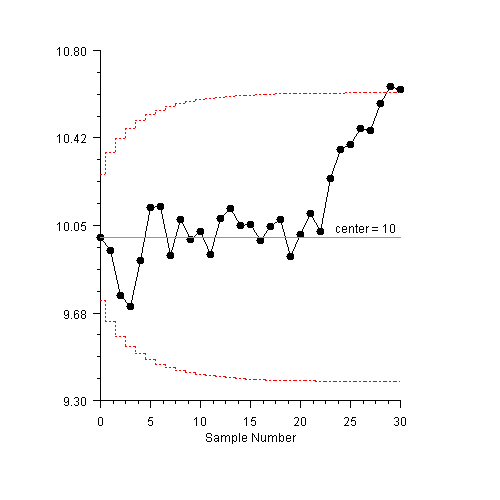
EWMA Example
The expected mean is 10., the expected standard deviation is 1.0 and  is 0.10.
Also, the control limit values are 2.7, not the default value of 3 (Montgomery 428).
is 0.10.
Also, the control limit values are 2.7, not the default value of 3 (Montgomery 428).
using Imsl.Chart2D;
using Imsl.Chart2D.QC;

public class SampleEWMA : FrameChart {
    static double[] data = {
        9.45, 7.99, 9.29, 11.66, 12.16, 10.18, 8.04, 11.46, 9.20, 10.34, 9.03,
        11.47, 10.51, 9.40, 10.08, 9.37, 10.62, 10.31, 8.52, 10.84, 10.90,
        9.33, 12.29, 11.50, 10.60, 11.08, 10.38, 11.62, 11.31, 10.52
    };

    public SampleEWMA() {
        Chart chart = this.Chart;
        AxisXY axis = new AxisXY(chart);
        double lambda = 0.10;
        double mean = 10.0;
        double stdev = 1.0;
        EWMA ewma = new EWMA(axis, data, lambda, mean, stdev);
        ewma.LowerControlLimit.ControlLimitValue = -2.7;
        ewma.UpperControlLimit.ControlLimitValue = 2.7;

        axis.AxisX.AxisTitle.SetTitle(“Sample Number”);
        axis.AxisX.AxisLabel.TextFormat = “0”;
        axis.AxisY.SetWindow(9.3, 10.8);
        axis.AxisY.AutoscaleInput = 0;
    }

    public static void Main(string[] argv) {
        System.Windows.Forms.Application.Run(new SampleEWMA());
    }
}
| © Visual Numerics, Inc. All rights reserved. |
|