IMSL C# Programmer’s Guide


IMSL C# Programmer’s Guide
|
Quality Control and Improvement Charts >> XmR |
|
XmR
XmR is a moving range chart. It is used when only samples of size one are available.
The moving range statistic is
The control limits are computed using

Where  is the mean of the observations,
  is the mean of the moving ranges and
  is the mean of the distribution of the ranges of n samples from the normal distribution
with mean zero and standard deviation one.
is the mean of the distribution of the ranges of n samples from the normal distribution
with mean zero and standard deviation one.
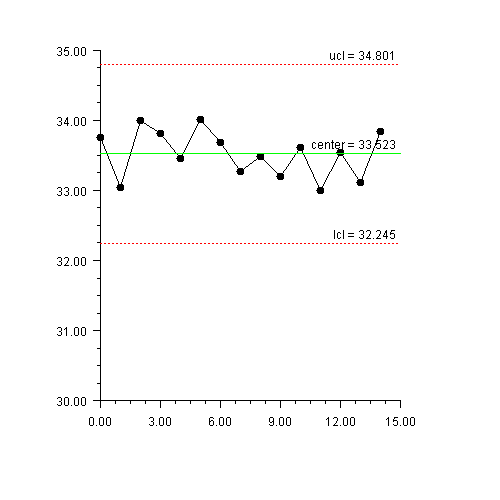
XmR Example
The viscosity of aircraft primer paint was measured. Since the paint is produced in batches, only single samples are available (Montgomery 251).
(Download Code)using Imsl.Chart2D;
using Imsl.Chart2D.QC;
public class SampleXmR : FrameChart {
static double[] viscosity = {
33.75, 33.05, 34.00, 33.81, 33.46, 34.02, 33.68,
33.27, 33.49, 33.20, 33.62, 33.00, 33.54, 33.12, 33.84
};
public SampleXmR() {
Chart chart = this.Chart;
AxisXY axis = new AxisXY(chart);
XmR xmr = new XmR(axis, viscosity);
}
public static void Main(string[] argv) {
System.Windows.Forms.Application.Run(new SampleXmR());
}
}
| © Visual Numerics, Inc. All rights reserved. |
|