IMSL C# Programmer’s Guide


IMSL C# Programmer’s Guide
|
Quality Control and Improvement Charts >> XbarR and RChart |
|
XbarR and RChart
If the sample sizes are small, say less than 10, then the in-sample ranges can be
used instead of the in-sample standard deviations. The XbarR class plots the mean
of each sample as well as control limits computed using the mean of the in-sample
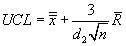
ranges,  . The positions of the control limits are determined by the equations.

where  is the grand mean (the average of all obeservations), and
  is the mean
of the distribution of the ranges of n samples from the normal distribution with
mean of zero and standard deviation of one. The standard deviation of this distribution
is
is the mean
of the distribution of the ranges of n samples from the normal distribution with
mean of zero and standard deviation of one. The standard deviation of this distribution
is  .
Therefore
.
Therefore

is an estimator of the standard deviation of the ranges.
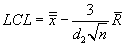
XbarR Example
This example creates an XbarR chart using the same piston ring data previously
used limit for the XbarS chart. Here the in-sample ranges are used to compute the
control limits, rather than the in-sample standard deviations (Montgomery 215).
using Imsl.Chart2D;
using Imsl.Chart2D.QC;

public class SampleXbarR : FrameChart {
    static double[][] diameter = {
        new double[] {74.03, 74.002, 74.019, 73.992, 74.008},
        new double[] {73.995, 73.992, 74.001, 74.011, 74.004},
        new double[] {73.988, 74.024, 74.021, 74.005, 74.002},
        new double[] {74.002, 73.996, 73.993, 74.015, 74.009},
        new double[] {73.992, 74.007, 74.015, 73.989, 74.014},
        new double[] {74.009, 73.994, 73.997, 73.985, 73.993},
        new double[] {73.995, 74.006, 73.994, 74, 74.005},
        new double[] {73.985, 74.003, 73.993, 74.015, 73.988},
        new double[] {74.008, 73.995, 74.009, 74.005, 74.004},
        new double[] {73.998, 74, 73.99, 74.007, 73.995},
        new double[] {73.994, 73.998, 73.994, 73.995, 73.99},
        new double[] {74.004, 74, 74.007, 74, 73.996},
        new double[] {73.983, 74.002, 73.998, 73.997, 74.012},
        new double[] {74.006, 73.967, 73.994, 74, 73.984},
        new double[] {74.012, 74.014, 73.998, 73.999, 74.007},
        new double[] {74, 73.984, 74.005, 73.998, 73.996},
        new double[] {73.994, 74.012, 73.986, 74.005, 74.007},
        new double[] {74.006, 74.01, 74.018, 74.003, 74},
        new double[] {73.984, 74.002, 74.003, 74.005, 73.997},
        new double[] {74, 74.01, 74.013, 74.02, 74.003},
        new double[] {73.982, 74.001, 74.015, 74.005, 73.996},
        new double[] {74.004, 73.999, 73.99, 74.006, 74.009},
        new double[] {74.01, 73.989, 73.99, 74.009, 74.014},
        new double[] {74.015, 74.008, 73.993, 74, 74.01},
        new double[] {73.982, 73.984, 73.995, 74.017, 74.013}
    };


    public SampleXbarR() {
        Chart chart = this.Chart;
        AxisXY axis = new AxisXY(chart);
        XbarR xbarr = new XbarR(axis, diameter);

        xbarr.UpperControlLimit.SetTitle(“ucl = {0:0.0000}”);

        axis.AxisX.AxisTitle.SetTitle(“Sample Number”);
        axis.AxisX.AxisLabel.TextFormat = “0”;
        axis.AxisY.AxisTitle.SetTitle(“Piston Ring Diameter”);
        axis.AxisY.AutoscaleInput = Axis.AUTOSCALE_OFF;
        axis.AxisY.SetWindow(73.985, 74.015);
    }


    public static void Main(string[] argv) {
        System.Windows.Forms.Application.Run(new SampleXbarR());
    }
}
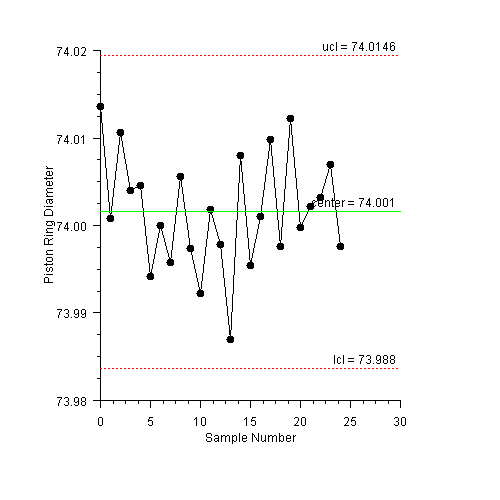
XbarRCombo Example
This example combines the XbarR chart with the corresponding RChart into a
single chart. This is done by adjusting the Viewport attribute values for the two
subcharts (Montgomery 215).
using Imsl.Chart2D;
using Imsl.Chart2D.QC;

public class SampleXbarRCombo : FrameChart {
    static double[][] diameter = {
        new double[] {74.03, 74.002, 74.019, 73.992, 74.008},
        new double[] {73.995, 73.992, 74.001, 74.011, 74.004},
        new double[] {73.988, 74.024, 74.021, 74.005, 74.002},
        new double[] {74.002, 73.996, 73.993, 74.015, 74.009},
        new double[] {73.992, 74.007, 74.015, 73.989, 74.014},
        new double[] {74.009, 73.994, 73.997, 73.985, 73.993},
        new double[] {73.995, 74.006, 73.994, 74, 74.005},
        new double[] {73.985, 74.003, 73.993, 74.015, 73.988},
        new double[] {74.008, 73.995, 74.009, 74.005, 74.004},
        new double[] {73.998, 74, 73.99, 74.007, 73.995},
        new double[] {73.994, 73.998, 73.994, 73.995, 73.99},
        new double[] {74.004, 74, 74.007, 74, 73.996},
        new double[] {73.983, 74.002, 73.998, 73.997, 74.012},
        new double[] {74.006, 73.967, 73.994, 74, 73.984},
        new double[] {74.012, 74.014, 73.998, 73.999, 74.007},
        new double[] {74, 73.984, 74.005, 73.998, 73.996},
        new double[] {73.994, 74.012, 73.986, 74.005, 74.007},
        new double[] {74.006, 74.01, 74.018, 74.003, 74},
        new double[] {73.984, 74.002, 74.003, 74.005, 73.997},
        new double[] {74, 74.01, 74.013, 74.02, 74.003},
        new double[] {73.982, 74.001, 74.015, 74.005, 73.996},
        new double[] {74.004, 73.999, 73.99, 74.006, 74.009},
        new double[] {74.01, 73.989, 73.99, 74.009, 74.014},
        new double[] {74.015, 74.008, 73.993, 74, 74.01},
        new double[] {73.982, 73.984, 73.995, 74.017, 74.013}
    };


    public SampleXbarRCombo() {
        Chart chart = this.Chart;
        ShewhartControlChart[] charts =
            XbarR.CreateCharts(chart, diameter);
        AxisXY axis = (AxisXY)(charts[0].Axis);
        axis.AxisY.AutoscaleInput = Axis.AUTOSCALE_OFF;
        axis.AxisY.SetWindow(73.985, 74.015);
    }


    public static void Main(string[] argv) {
        System.Windows.Forms.Application.Run(new SampleXbarRCombo());
    }
}
| © Visual Numerics, Inc. All rights reserved. |
|