IMSL C# Programmer’s Guide


IMSL C# Programmer’s Guide
|
Charting 2D Types >> Box Plot |
|
Box Plot
Box plots are used to show statistics about multiple groups of observations.
For each group of observations, the box limits represent the lower quartile (25-th
percentile) and upper quartile (75-th percentile). The median is displayed as a line
across the box. Whiskers are drawn from the upper quartile to the upper adjacent
value, and from the lower quartile to the lower adjacent value.
Optional notches may be displayed to show a 95 percent confidence interval about
the median, at  where IRQ is the interquartile range and n is the number of observations. Outside
and far outside values may be displayed as symbols. Outside values are outside the
inner fence. Far out values are outside the outer fence.
where IRQ is the interquartile range and n is the number of observations. Outside
and far outside values may be displayed as symbols. Outside values are outside the
inner fence. Far out values are outside the outer fence.
The BoxPlot has several child nodes. Any of these nodes can be disabled by setting
their Paint attribute to false.
Bodies node has the main body of the box plot elements. Its fill attributes
determine the drawing of (notched) rectangle (see Fill Area Attributes). Its line
attributes determine the drawing of the median line. The width of the box is
controlled by the MarkerSize attribute (see Attribute MarkerSize) .
Whiskers node draws the lines to the upper and lower quartile. Its drawing
is affected by the marker attributes.
FarMarkers node hold the far markers. Its drawing is affected by the
marker attributes.
OutsideMarkers node hold the outside markers. Its drawing is
affected by the marker attributes.
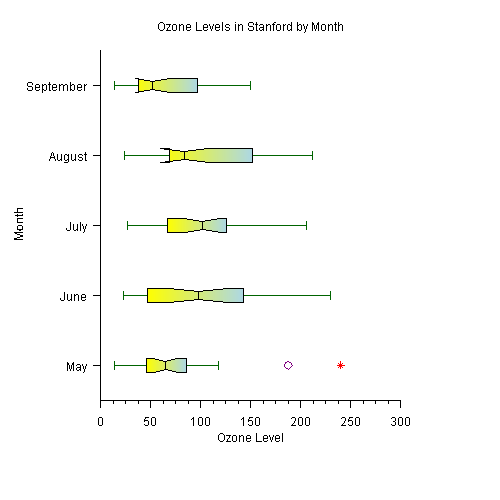
Example
In this example, the Fisher iris data set is read from a file and a Box plot is created
from data. The data is in a file called FisherIris.csv (see Attribute MarkerSize
) in the same directory as this class.
The y-axis labels are taken from the column names.
The boxes are colored green, the markers are all filled circles. The outside markers are blue and the far outside markers would be red, if there were any.
(Download Code)
using Imsl.Chart2D;
using System.Drawing;
using System.IO;

public class SampleBoxPlot : FrameChart {
    private double[][] irisData;
    private string[] labels;

    public SampleBoxPlot() {
        ReadData(“FisherIris.csv”);

        Chart chart = this.Chart;
        AxisXY axis = new AxisXY(chart);
        BoxPlot boxPlot = new BoxPlot(axis, irisData);
        boxPlot.BoxPlotType = BoxPlot.BOXPLOT_TYPE_HORIZONTAL;
        boxPlot.SetLabels(labels);
        boxPlot.Bodies.FillColor = Color.Green;
        boxPlot.MarkerType = BoxPlot.MARKER_TYPE_FILLED_CIRCLE;
        boxPlot.OutsideMarkers.MarkerColor = Color.Blue;
        boxPlot.FarMarkers.MarkerColor = Color.Red;
        boxPlot.Notch = true;
    }

    public static void Main(string[] argv) {
        System.Windows.Forms.Application.Run(new SampleBoxPlot());
    }

    private void ReadData(string fileName) {
        int nColumns = 5;
        int nObs = 150;
        irisData = new double[nColumns][];
        for (int i = 0; i < nColumns; i++) irisData[i] = new double[nObs];

        string line;
        string[] tokens;
        int lineCount = 0;
        StreamReader sr = new StreamReader(fileName);
        line = sr.ReadLine();
        labels = line.Split(`,’);
        for (int i = 0; i < nObs; i++) {
            line = sr.ReadLine();
            tokens = line.Split(`,’);
            for (int j = 0; j < nColumns; j++) {
                irisData[j][lineCount] = double.Parse(tokens[j].Trim());
            }
            lineCount++;
        }
    }
}
| © Visual Numerics, Inc. All rights reserved. |
|