IMSL C# Programmer’s Guide


IMSL C# Programmer’s Guide
|
Charting 2D Types >> Line Plot |
|
Line Plot
A line plot consists of points connected by lines. The lines can be formatted using the Line Attributes.
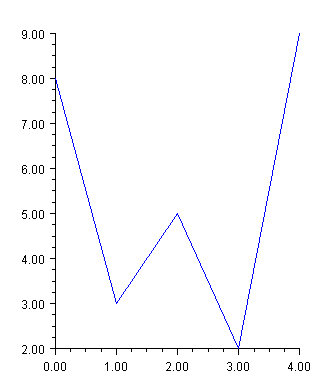
Simple Line Plot
This example shows a simple line plot. The Data node is created using an array of
y-values. The x-values default to 0, 1, .... The DataType attribute is set to
DATA_TYPE_LINE to make this a line chart. The look of the line is controlled by
the line attributes. Here the LineColor attribute is set to blue.
(Download Code)
using Imsl.Chart2D;
using System.Drawing;

public class SampleSimpleLine : FrameChart {

    public SampleSimpleLine() {
        Chart chart = this.Chart;
        AxisXY axis = new AxisXY(chart);

        double[] y = new double[] {8, 3, 5, 2, 9};
        Data data1 = new Data(axis, y);
        data1.DataType = Data.DATA_TYPE_LINE;
        data1.LineColor = Color.Blue;
    }

    public static void Main(string[] argv) {
        System.Windows.Forms.Application.Run(new SampleSimpleLine());
    }
}
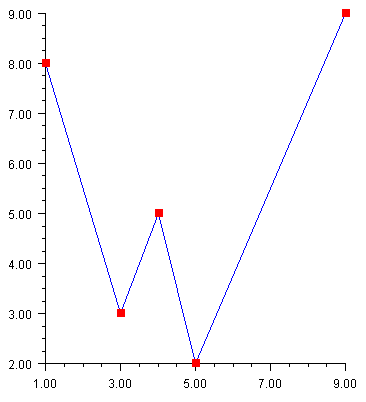
Mixed Line and Marker Plot
The DataType attribute can be set using “or” syntax to combine types. In this
example, it is set to DATA_TYPE_LINE | DATA_TYPE_MARKER. This example
also explicitly sets both the x and the y values of the data points. Note that the x
values do not have to be uniformly spaced.
(Download Code)
using Imsl.Chart2D;
using System.Drawing;

public class SampleLineMarker : FrameChart {

    public SampleLineMarker() {
        Chart chart = this.Chart;
        AxisXY axis = new AxisXY(chart);

        double[] x = new double[] {1, 3, 4, 5, 9};
        double[] y = new double[] {8, 3, 5, 2, 9};
        Data data1 = new Data(axis, x, y);
        data1.DataType = Data.DATA_TYPE_LINE | Data.DATA_TYPE_MARKER;
        data1.LineColor = Color.Blue;
        data1.MarkerColor = Color.Red;
        data1.MarkerType = Data.MARKER_TYPE_FILLED_SQUARE;
    }

    public static void Main(string[] argv) {
        System.Windows.Forms.Application.Run(new SampleLineMarker());
    }
}
| © Visual Numerics, Inc. All rights reserved. |
|