IMSL C# Programmer’s Guide


IMSL C# Programmer’s Guide
|
Quality Control and Improvement Charts >> ShewhartControlChart and ControlLimit |
|
ShewhartControlChart and ControlLimit
The ShewhartControlChart class is primarily used as the base class of other
control chart classes. It provides the common functionality for the control charts.
For example, the default IMSL.NET control charts include a center line and an
upper and lower control limits at plus or minus three standard deviations from the
center line. The Western Electric Company Rules (or WECO) are control limits at
plus or minus one, two, and three standard deviations from the mean. They can be
added using the method AddWecoLimits in the ShewhartControlChart
class.
The ShewhartControlChart uses the ControlLimit class for the upper
and lower control limits and for the center line. Additional control limits, such as
the WECO limits, can be added to a ShewhartControlChart. The line
attributes can be used with ControlLimit to modify the drawing of each control
limit.
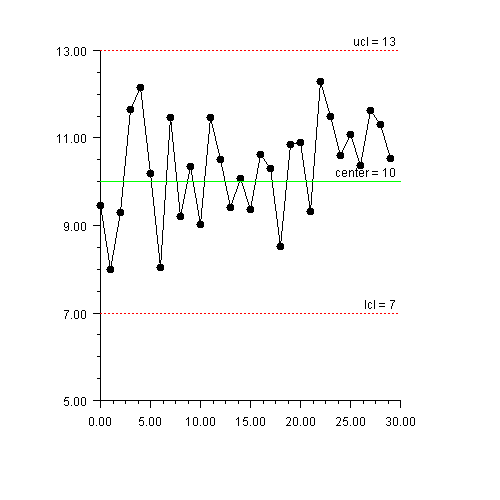
The ShewhartControlChart class can be used directly when the statistics are
computed by the user. In this example, data from Montgomery, Douglas C., Introduction
to Statistical Quality Control, 4th Ed,., 2001, New York: John Wiley and
Sons, p. 406 is plotted. The code explicitly sets the lower control limit to 7 and the
upper control limit to 13.
Further citations throughout this chapter for data plotted from Montgomery appear as parenthetical citations, e.g. (Montgomery 406).
(Download Code)using Imsl.Chart2D;
using Imsl.Chart2D.QC;
public class SampleShewhart : FrameChart {
static double[] data = {
9.45, 7.99, 9.29, 11.66, 12.16, 10.18, 8.04, 11.46, 9.20, 10.34, 9.03,
11.47, 10.51, 9.40, 10.08, 9.37, 10.62, 10.31, 8.52, 10.84, 10.90,
9.33, 12.29, 11.50, 10.60, 11.08, 10.38, 11.62, 11.31, 10.52
};
public SampleShewhart() {
Chart chart = this.Chart;
AxisXY axis = new AxisXY(chart);
ShewhartControlChart xbars = new ShewhartControlChart(axis);
xbars.SetData(data);
xbars.AddLowerControlLimit().SetValue(7);
xbars.AddCenterLine().SetValue(10);
xbars.AddUpperControlLimit().SetValue(13);
}
public static void Main(string[] argv) {
System.Windows.Forms.Application.Run(new SampleShewhart());
}
}
| © Visual Numerics, Inc. All rights reserved. |
|