IMSL C# Programmer’s Guide


IMSL C# Programmer’s Guide
|
Quality Control and Improvement Charts >> XbarS and SChart |
|
XbarS and SChart
The XbarS class plots the mean of each sample as well as control limits computed
using the mean of the in-sample standard deviations,  .
The positions of the control
limits are determined by the equations
.
The positions of the control
limits are determined by the equations

where  is the grand mean, the average of all the observations.
The factor of three in the above equations can be changed by setting the chart
attribute ControlLimit. The attribute applies similarly to all of the control
charts.
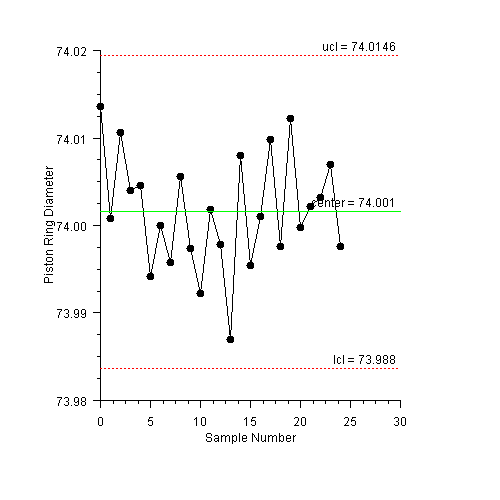
XbarS Example
The process of forging piston rings for automobile engines was monitored. The inside diameters of 25 samples, each containing 5 piston rings, were measured. The center line is at 74.001, the average diameter of all of the measured piston rings. The upper and lower control limits are determined by the average of the standard deviations of the 25 samples of 5 rings (Montgomery 215).
(Download Code)using Imsl.Chart2D;
using Imsl.Chart2D.QC;
public class SampleXbarS : FrameChart {
static double[][] diameter = {
new double[] {74.03, 74.002, 74.019, 73.992, 74.008},
new double[] {73.995, 73.992, 74.001, 74.011, 74.004},
new double[] {73.988, 74.024, 74.021, 74.005, 74.002},
new double[] {74.002, 73.996, 73.993, 74.015, 74.009},
new double[] {73.992, 74.007, 74.015, 73.989, 74.014},
new double[] {74.009, 73.994, 73.997, 73.985, 73.993},
new double[] {73.995, 74.006, 73.994, 74, 74.005},
new double[] {73.985, 74.003, 73.993, 74.015, 73.988},
new double[] {74.008, 73.995, 74.009, 74.005, 74.004},
new double[] {73.998, 74, 73.99, 74.007, 73.995},
new double[] {73.994, 73.998, 73.994, 73.995, 73.99},
new double[] {74.004, 74, 74.007, 74, 73.996},
new double[] {73.983, 74.002, 73.998, 73.997, 74.012},
new double[] {74.006, 73.967, 73.994, 74, 73.984},
new double[] {74.012, 74.014, 73.998, 73.999, 74.007},
new double[] {74, 73.984, 74.005, 73.998, 73.996},
new double[] {73.994, 74.012, 73.986, 74.005, 74.007},
new double[] {74.006, 74.01, 74.018, 74.003, 74},
new double[] {73.984, 74.002, 74.003, 74.005, 73.997},
new double[] {74, 74.01, 74.013, 74.02, 74.003},
new double[] {73.982, 74.001, 74.015, 74.005, 73.996},
new double[] {74.004, 73.999, 73.99, 74.006, 74.009},
new double[] {74.01, 73.989, 73.99, 74.009, 74.014},
new double[] {74.015, 74.008, 73.993, 74, 74.01},
new double[] {73.982, 73.984, 73.995, 74.017, 74.013}
};
public SampleXbarS() {
Chart chart = this.Chart;
AxisXY axis = new AxisXY(chart);
XbarS xbars = new XbarS(axis, diameter);
xbars.UpperControlLimit.SetTitle(“ucl = {0:0.0000}”);
axis.AxisX.AxisTitle.SetTitle(“Sample Number”);
axis.AxisX.AxisLabel.TextFormat = “0”;
axis.AxisY.AxisTitle.SetTitle(“Piston Ring Diameter”);
axis.AxisY.AutoscaleInput = Axis.AUTOSCALE_OFF;
axis.AxisY.SetWindow(73.985, 74.015);
}
public static void Main(string[] argv) {
System.Windows.Forms.Application.Run(new SampleXbarS());
}
}
The SChart plots the in-sample standard deviations of the observations as well as
control limits computed using

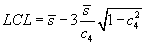
The factor  is such that
  is an unbiased estimator of
  .
.
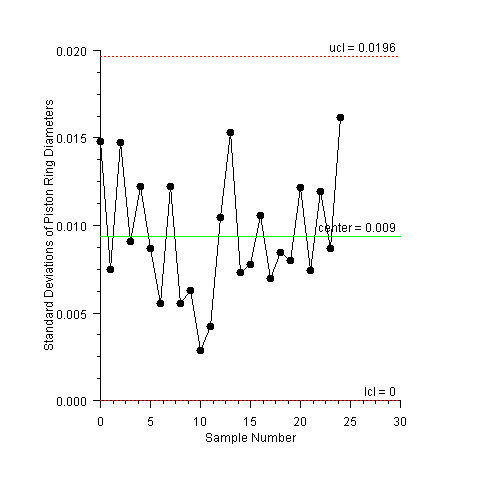
SChart Example
This example uses the same piston ring data as was used in the XbarS example,
but now the standard deviations of the samples are plotted. The center line is at
0.009, the average of the sample standard deviations.
using Imsl.Chart2D;
using Imsl.Chart2D.QC;

public class SampleSChart : FrameChart {
    static double[][] diameter = {
        new double[] {74.03, 74.002, 74.019, 73.992, 74.008},
        new double[] {73.995, 73.992, 74.001, 74.011, 74.004},
        new double[] {73.988, 74.024, 74.021, 74.005, 74.002},
        new double[] {74.002, 73.996, 73.993, 74.015, 74.009},
        new double[] {73.992, 74.007, 74.015, 73.989, 74.014},
        new double[] {74.009, 73.994, 73.997, 73.985, 73.993},
        new double[] {73.995, 74.006, 73.994, 74, 74.005},
        new double[] {73.985, 74.003, 73.993, 74.015, 73.988},
        new double[] {74.008, 73.995, 74.009, 74.005, 74.004},
        new double[] {73.998, 74, 73.99, 74.007, 73.995},
        new double[] {73.994, 73.998, 73.994, 73.995, 73.99},
        new double[] {74.004, 74, 74.007, 74, 73.996},
        new double[] {73.983, 74.002, 73.998, 73.997, 74.012},
        new double[] {74.006, 73.967, 73.994, 74, 73.984},
        new double[] {74.012, 74.014, 73.998, 73.999, 74.007},
        new double[] {74, 73.984, 74.005, 73.998, 73.996},
        new double[] {73.994, 74.012, 73.986, 74.005, 74.007},
        new double[] {74.006, 74.01, 74.018, 74.003, 74},
        new double[] {73.984, 74.002, 74.003, 74.005, 73.997},
        new double[] {74, 74.01, 74.013, 74.02, 74.003},
        new double[] {73.982, 74.001, 74.015, 74.005, 73.996},
        new double[] {74.004, 73.999, 73.99, 74.006, 74.009},
        new double[] {74.01, 73.989, 73.99, 74.009, 74.014},
        new double[] {74.015, 74.008, 73.993, 74, 74.01},
        new double[] {73.982, 73.984, 73.995, 74.017, 74.013}
    };


    public SampleSChart() {
        Chart chart = this.Chart;
        AxisXY axis = new AxisXY(chart);
        SChart schart = new SChart(axis, diameter);

        schart.UpperControlLimit.SetTitle(“ucl = {0:0.0000}”);

        axis.AxisX.AxisTitle.SetTitle(“Sample Number”);
        axis.AxisX.AxisLabel.TextFormat = “0”;
        axis.AxisY.AxisTitle.SetTitle(“Standard Deviations of Piston Ring Diameters”);
        axis.AxisY.AxisLabel.TextFormat = “0.000”;
        axis.AxisY.AutoscaleInput = Axis.AUTOSCALE_OFF;
        axis.AxisY.SetWindow(0.0, 0.02);
    }


    public static void Main(string[] argv) {
        System.Windows.Forms.Application.Run(new SampleSChart());
    }
}
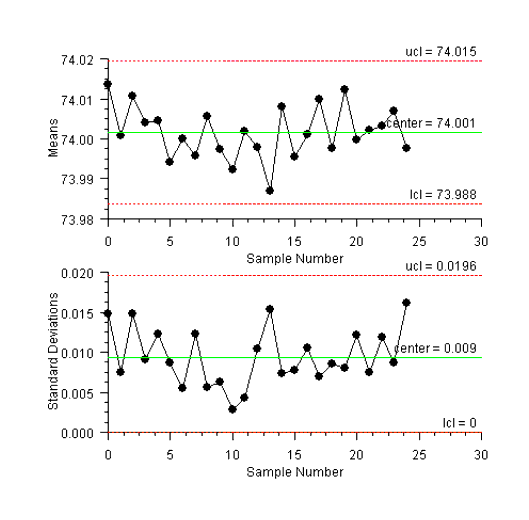
Often the XbarS and SChart are plotted together. The XbarS class contains
static methods, CreateCharts, which create this pair of plots on a single chart.
XbarSCombo Example
This example combines the charts in the XbarS and SChart examples. The
Viewport attribute of each is set so that they can appear on the same chart.
using Imsl.Chart2D;
using Imsl.Chart2D.QC;

public class SampleXbarSCombo : FrameChart {
    static double[][] diameter = {
        new double[] {74.03, 74.002, 74.019, 73.992, 74.008},
        new double[] {73.995, 73.992, 74.001, 74.011, 74.004},
        new double[] {73.988, 74.024, 74.021, 74.005, 74.002},
        new double[] {74.002, 73.996, 73.993, 74.015, 74.009},
        new double[] {73.992, 74.007, 74.015, 73.989, 74.014},
        new double[] {74.009, 73.994, 73.997, 73.985, 73.993},
        new double[] {73.995, 74.006, 73.994, 74, 74.005},
        new double[] {73.985, 74.003, 73.993, 74.015, 73.988},
        new double[] {74.008, 73.995, 74.009, 74.005, 74.004},
        new double[] {73.998, 74, 73.99, 74.007, 73.995},
        new double[] {73.994, 73.998, 73.994, 73.995, 73.99},
        new double[] {74.004, 74, 74.007, 74, 73.996},
        new double[] {73.983, 74.002, 73.998, 73.997, 74.012},
        new double[] {74.006, 73.967, 73.994, 74, 73.984},
        new double[] {74.012, 74.014, 73.998, 73.999, 74.007},
        new double[] {74, 73.984, 74.005, 73.998, 73.996},
        new double[] {73.994, 74.012, 73.986, 74.005, 74.007},
        new double[] {74.006, 74.01, 74.018, 74.003, 74},
        new double[] {73.984, 74.002, 74.003, 74.005, 73.997},
        new double[] {74, 74.01, 74.013, 74.02, 74.003},
        new double[] {73.982, 74.001, 74.015, 74.005, 73.996},
        new double[] {74.004, 73.999, 73.99, 74.006, 74.009},
        new double[] {74.01, 73.989, 73.99, 74.009, 74.014},
        new double[] {74.015, 74.008, 73.993, 74, 74.01},
        new double[] {73.982, 73.984, 73.995, 74.017, 74.013}
    };


    public SampleXbarSCombo() {
        Chart chart = this.Chart;
        ShewhartControlChart[] charts = XbarS.CreateCharts(chart, diameter);
        AxisXY axis = (AxisXY)(charts[0].Axis);
        axis.AxisY.AutoscaleInput = Axis.AUTOSCALE_OFF;
        axis.AxisY.SetWindow(73.985, 74.015);

        axis = (AxisXY)(charts[1].Axis);
        axis.AxisY.AxisLabel.TextFormat = “0.000”;
        axis.AxisY.AutoscaleInput = Axis.AUTOSCALE_OFF;
        axis.AxisY.SetWindow(0.0, 0.02);
        ((SChart)charts[1]).UpperControlLimit.SetTitle(“ucl = {0:0.0000}”);
    }


    public static void Main(string[] argv) {
        System.Windows.Forms.Application.Run(new SampleXbarSCombo());
    }
}
XbarSUnequal Example
The example again uses the piston ring data, but now the sample size is not uniform. The upper and lower control limits are now stair step lines. The control limits are farther apart for smaller samples.
It is also possible to plot just the XbarS or SChart with unequal sample sizes.
using Imsl.Chart2D;
using Imsl.Chart2D.QC;

public class SampleXbarSUnequal : FrameChart {
    static double[][] diameter = {
        new double[] {74.03, 74.002, 74.019, 73.992, 74.008},
        new double[] {73.995, 73.992, 74.001},
        new double[] {73.988, 74.024, 74.021, 74.005, 74.002},
        new double[] {74.002, 73.996, 73.993, 74.015, 74.009},
        new double[] {73.992, 74.007, 74.015, 73.989, 74.014},
        new double[] {74.009, 73.994, 73.997, 73.985},
        new double[] {73.995, 74.006, 73.994, 74},
        new double[] {73.985, 74.003, 73.993, 74.015, 73.988},
        new double[] {74.008, 73.995, 74.009, 74.005},
        new double[] {73.998, 74, 73.99, 74.007, 73.995},
        new double[] {73.994, 73.998, 73.994, 73.995, 73.99},
        new double[] {74.004, 74, 74.007, 74, 73.996},
        new double[] {73.983, 74.002, 73.998},
        new double[] {74.006, 73.967, 73.994, 74, 73.984},
        new double[] {74.012, 74.014, 73.998},
        new double[] {74, 73.984, 74.005, 73.998, 73.996},
        new double[] {73.994, 74.012, 73.986, 74.005},
        new double[] {74.006, 74.01, 74.018, 74.003, 74},
        new double[] {73.984, 74.002, 74.003, 74.005, 73.997},
        new double[] {74, 74.01, 74.013},
        new double[] {73.982, 74.001, 74.015, 74.005, 73.996},
        new double[] {74.004, 73.999, 73.99, 74.006, 74.009},
        new double[] {74.01, 73.989, 73.99, 74.009, 74.014},
        new double[] {74.015, 74.008, 73.993, 74, 74.01},
        new double[] {73.982, 73.984, 73.995, 74.017, 74.013}
    };


    public SampleXbarSUnequal() {
        Chart chart = this.Chart;
        ShewhartControlChart[] charts = XbarS.CreateCharts(chart, diameter);
        AxisXY axis = (AxisXY)(charts[0].Axis);
        axis.AxisY.AutoscaleInput = Axis.AUTOSCALE_OFF;
        axis.AxisY.SetWindow(73.980, 74.020);
        ((SChart)charts[1]).UpperControlLimit.SetTitle(“ucl = {0:0.0000}”);
    }


    public static void Main(string[] argv) {
        System.Windows.Forms.Application.Run(new SampleXbarSUnequal());
    }
}
| © Visual Numerics, Inc. All rights reserved. |
|