A Candlestick chart is used to show stock price. Each candlestick shows the stock’s high, low, opening and closing prices.
The Candlestick constructors create two child CandlestickItem nodes. One is for the up days and one is for the down days. A day is an up day if the closing price is greater than the opening price. The Up and Down accessor properties can be used to retrieve these nodes.
The line (“whisker”) part of a candlestick shows the stock’s high and low prices. The whiskers can be formatted using the line attributes (see Line Attributes).
The body of a candlestick shows the stock’s opening and closing prices. The body color is used to flag if the top of the body is the closing price (up day) or the opening price (down day). The fill area attributes determine how the body is drawn (see Fill Area Attributes. By default, up days are white and down days are black.
The width of a candlestick is controlled by the MarkerSize attribute (see Attribute MarkerSize).
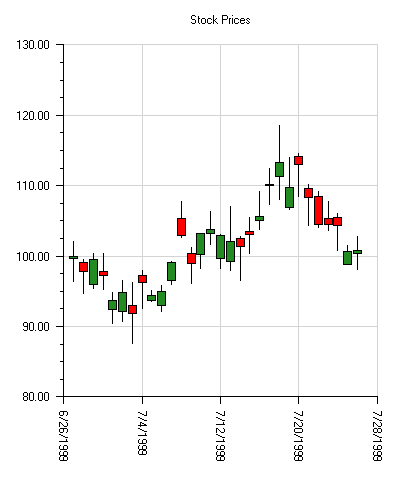
Example
In this example, random security prices are computed in the CreateData method. The time axis is prepared by calling SetDateAxis.
The up days are colored green and the down days are colored red.
using Imsl.Chart2D;
using System;
using System.Drawing;
public class SampleCandlestick : FrameChart {
private double[] high, low, open, close;
public SampleCandlestick() {
Chart chart = this.Chart;
AxisXY axis = new AxisXY(chart);
// Date is June 27, 1999
DateTime date = new DateTime(1999, 6, 27);
int n = 30;
CreateData(n);
// Create an instance of a Candlestick Chart
Candlestick stick = new Candlestick(axis, date, high, low,
close, open);
// show up days in green and down days in red
stick.Up.FillColor = Color.ForestGreen;
stick.Down.FillColor = Color.Red;
// Set the HighLowClose Chart Title
chart.ChartTitle.SetTitle("Stock Prices");
// Setup the time axis
stick.SetDateAxis("d");
// Turn on grid and make it light gray
axis.AxisX.Grid.IsVisible = true;
axis.AxisX.Grid.LineColor = Color.LightGray;
axis.AxisY.Grid.IsVisible = true;
axis.AxisY.Grid.LineColor = Color.LightGray;
}
private void CreateData(int n) {
high = new double[n];
low = new double[n];
close = new double[n];
open = new double[n];
Random r = new Random(123457);
for (int k = 0; k < n; k++) {
double f = r.NextDouble();
if (k == 0) {
close[0] = 100;
} else {
close[k] = (0.95+0.10*f)*close[k-1];
}
high[k] = close[k]*(1+0.05*r.NextDouble());
low[k] = close[k]*(1-0.05*r.NextDouble());
open[k] = low[k] + r.NextDouble()*(high[k]-low[k]);
}
}
public static void Main(string[] argv) {
System.Windows.Forms.Application.Run(new SampleCandlestick());
}
}
|
PHONE: 713.784.3131 FAX:713.781.9260 |