A pie chart is a graphical way to organize data. This section describes the construction of a pie chart.
Example
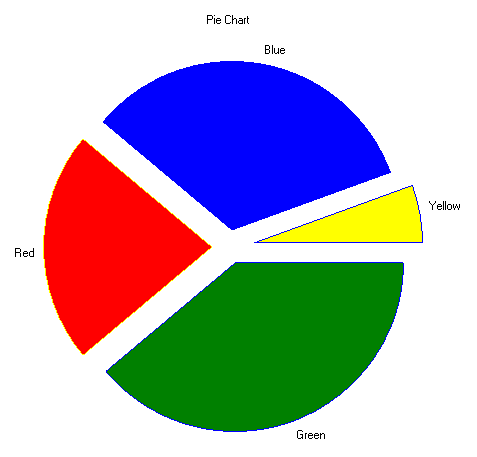
The FrameChart class is used to create a frame containing a Chart node. A Pie node is then created as a child of the Chart node. The Pie node constructor creates PieSlice nodes as its children. The number of PieSlice nodes created is y.Length, here equal to 4. After the PieSlice nodes are created they are retrieved from the Pie object and customized by setting attributes.
The LabelType attribute is set in the pie node. The pie node itself does not use this attribute, but from there it is inherited by all of the PieSlice nodes.
The Title attribute is set in each PieSlice node. This is the slice label. It is used to label the slice only if the slice’s LabelType attribute is LABEL_TYPE_TITLE.
The FillColor attribute is also set in each slice. This determines the color of the slice. Since the default value of FillColor is black, it is generally recommended that FillColor be set in each slice.
The FillOutlineColor attribute sets the border color of each slice. In this example it is set in the pie node to be blue and set in the slice[1] node to be yellow. All except slice[1] are outlined in blue, and slice[1] is outlined in yellow.
The Explode attribute moves a pie slice out from the center. Its default value is 0, which puts the slice vertex in the center. A value of 1.0 would put the slice vertex on the circumference.
using Imsl.Chart2D;
using System.Drawing;
public class SamplePieChart : FrameChart
{
public SamplePieChart()
{
Chart chart = this.Chart;
chart.ChartTitle.SetTitle("Pie Chart");
double[] y = new double[] {35, 20, 30, 5};
Pie pie = new Pie(chart, y);
pie.LabelType = Pie.LABEL_TYPE_TITLE;
pie.FillOutlineColor = Color.Blue;
pie.SetViewport(0.0, 1.0, 0.0, 1.0);
PieSlice[] slice = pie.GetPieSlice();
slice[0].FillColor = Color.Green;
slice[0].SetTitle("Green");
slice[0].Explode = 0.1;
slice[1].FillColor = Color.Red;
slice[1].SetTitle("Red");
slice[1].FillOutlineColor = Color.Yellow;
slice[1].Explode = 0.1;
slice[2].FillColor = Color.Blue;
slice[2].SetTitle("Blue");
slice[2].Explode = 0.1;
slice[3].FillColor = Color.Yellow;
slice[3].SetTitle("Yellow");
slice[3].Explode = 0.15;
}
public static void Main(string[] argv)
{
System.Windows.Forms.Application.Run(new SamplePieChart());
}
}
|
PHONE: 713.784.3131 FAX:713.781.9260 |