In a semilog plot the y-axis is logarithmically scaled, while the x-axis is linearly scaled. In a log-log plot both axes are logarithmically scaled.
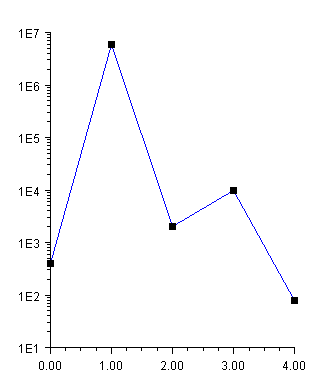
SemiLog Plot
In this example, data is plotted as lines and markers on a semilog axis.
To set up the y-axis as a logarithmic axis:
• the Transform attribute is set to TRANSFORM_LOG.
• the Density attribute is set to 9. Density is the number of minor ticks between major ticks. It is 9 because base 10 is used and the major tick marks are not counted.
The TextFormat, used by AxisLabel, is changed to use scientific notation (see “Text Attributes”). The default decimal format would result in large numbers written with many zeros.
using Imsl.Chart2D;
using System.Drawing;
public class SampleSemiLog : FrameChart {
public SampleSemiLog() {
Chart chart = this.Chart;
AxisXY axis = new AxisXY(chart);
axis.AxisY.Transform = Axis.TRANSFORM_LOG;
axis.AxisY.Density = 9;
axis.AxisY.TextFormat = "0.E0";
double[] y = new double[] {4e2, 6e6, 2e3, 1e4, 8e1};
Data data1 = new Data(axis, y);
data1.DataType = Data.DATA_TYPE_LINE | Data.DATA_TYPE_MARKER;
data1.LineColor = Color.Blue;
data1.MarkerType = Data.MARKER_TYPE_FILLED_SQUARE;
}
public static void Main(string[] argv) {
System.Windows.Forms.Application.Run(new SampleSemiLog());
}
}
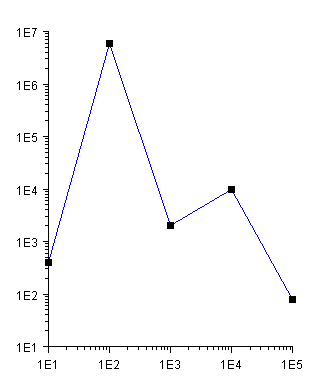
Log-Log Plot
A log-log plot is set up similarly as a semilog plot, except that the changes must be made to both the x-axis and the y-axis. In this example, the changes are made to the axis node and inherited by both the x and y-axis nodes.
using Imsl.Chart2D;
using System.Drawing;
public class SampleLogLog : FrameChart {
public SampleLogLog() {
Chart chart = this.Chart;
AxisXY axis = new AxisXY(chart);
axis.Transform = Axis.TRANSFORM_LOG;
axis.Density = 9;
axis.TextFormat = "0.E0";
double[] x = new double[] {1e1, 1e2, 1e3, 1e4, 1e5};
double[] y = new double[] {4e2, 6e6, 2e3, 1e4, 8e1};
Data data1 = new Data(axis, x, y);
data1.DataType = Data.DATA_TYPE_LINE | Data.DATA_TYPE_MARKER;
data1.LineColor = Color.Blue;
data1.MarkerType = Data.MARKER_TYPE_FILLED_SQUARE;
}
public static void Main(string[] argv) {
System.Windows.Forms.Application.Run(new SampleLogLog());
}
}
|
PHONE: 713.784.3131 FAX:713.781.9260 |