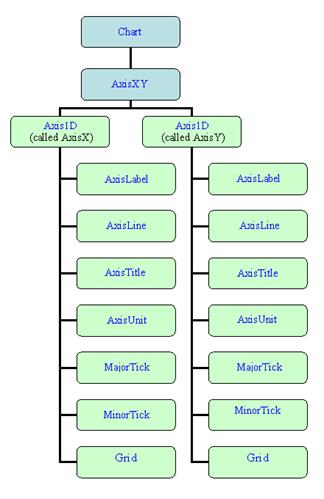
The AxisXY node is the basis of many chart types, including scatter, line, area and error bar. Its parent node must be the root Chart node.
When an AxisXY node is created, it creates two Axis1D nodes. They can be obtained by using the methods AxisXY.AxisX and AxisXY.AxisY. Each of the Axis1D nodes in turn creates additional child nodes, as seen in the diagram below.
Properties can be chained together, so the x-axis line can be retrieved using
axis.AxisX.AxisLine
The code to set the x-axis line to blue is
axis.AxisX. AxisLine.LineColor = Color.Blue;
Axis Layout
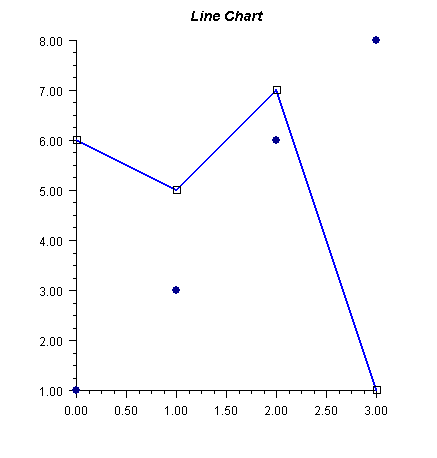
The layout of an AxisXY chart, such as the one below, is controlled by the attributes Window, Density, and Number.
using Imsl.Chart2D;
using System.Drawing;
public class Line : FrameChart
{
public Line()
{
Chart chart = Chart;
AxisXY axis = new AxisXY(chart);
chart.ChartTitle.FontSize = 14;
chart.ChartTitle.FontStyle = System.Drawing.FontStyle.Italic;
chart.ChartTitle.SetTitle("Line Chart");
double[] y1 = {6, 5, 7, 1};
Data data1 = new Data(axis, y1);
data1.DataType = Data.DATA_TYPE_LINE|Data.DATA_TYPE_MARKER;
data1.LineColor = System.Drawing.Color.Blue;
data1.LineWidth = 2.0;
data1.MarkerType = Data.MARKER_TYPE_HOLLOW_SQUARE;
data1.SetTitle("Blue Line");
double[] y2 = {1, 3, 6, 8};
Data data2 = new Data(axis, y2);
data2.DataType = Data.DATA_TYPE_MARKER;
data2.MarkerColor = System.Drawing.Color.DarkBlue;
data2.MarkerType = Data.MARKER_TYPE_FILLED_CIRCLE;
data2.SetTitle("Markers");
}
public static void Main(string[] argv)
{
System.Windows.Forms.Application.Run(new Line());
}
}
Window
Window is a double-array-valued attribute that contains the axis limits. Its value is {min, max}. The AxisXY.SetWindow should be used to set the window . For the above chart, the value of the Window attribute for the x-axis is [0, 3] and for the y-axis is [1, 8].
Number
Number is an integer-valued attribute that contains the number of major tick marks along an axis. IMSL charting is largely made up of classes that inherit from ChartNode. Therefore AbstractChartNode.Number should be used to set the number of ticks. In an Axis1D node its default value is 5, which is also the value in the above example.
Density
Density is the number of minor tick marks per major tick mark. IMSL charting is largely made up of classes that inherit from ChartNode. Therefore AbstractChartNode.Density should be used to set the Density. Its default value is 4, which is also the value in the example.
Transform
The x- and y-axes may be linear, logarithmic, or customized, as specified by the Transform attribute. IMSL charting is largely made up of classes that inherit from ChartNode. Therefore AbstractChartNode.Transform should be used to set the transform. This attribute can have the values:
• TRANSFORM_LINEAR indicating a linear axis. This is the default.
• TRANSFORM_LOG indicating a logarithmic axis.
• TRANSFORM_CUSTOM indicating a custom transformation. The transformation specified by the CustomTransform attribute is used.
CustomTransform
A customized transformation is used when the Transform attribute has the value TRANSFORM_CUSTOM. IMSL charting is largely made up of classes that inherit from ChartNode. Therefore AbstractChartNode.CustomTransform should be used to set the CustomTransform. A custom transform is an object implementing the Transform interface. It defines a mapping from the interval specified by the Window attribute to and from the interval [0,1]. See Custom Transform for more information.
The class TransformDate implements the Transform interface. It maps from a regular calendar to one without weekends, which is useful for charting stock prices that are defined only on weekdays.
Autoscale
Autoscaling is used to automatically determine the attribute Window (the range of numbers along an axis) and the attribute Number (the number of major tick marks). The goal is to adjust the attributes so that the data fits on the axes and the axes have “nice” numbers as labels.
Autoscaling is done in two phases. In the first (“input”) phase the actual range is determined. In the second (“output”) phase chart attributes are updated.
Attribute AutoscaleInput
The action of the input phase is controlled by the value of attribute AUTOSCALE_INPUT in the axis node. IMSL charting is largely made up of classes that inherit from ChartNode. Therefore AbstractChartNode.AutoscaleInput should be used to indicate how auto scaling is to be done. It can have one of three values.
• AUTOSCALE_OFF turns off autoscaling.
• AUTOSCALE_DATA scans the values in the Data nodes that are attached to the axis to determine the data range. This is the default value.
• AUTOSCALE_WINDOW uses the value of the Window attribute to determine the data range.
Attribute AutoscaleOutput
The value of the AUTOSCALE_OUTPUT attribute can be the bitwise combination of the following values.
• AUTOSCALE_OFF no attributes updated.
• AUTOSCALE_NUMBER updates the value of the Number attribute. This is the number of major tick marks along the axis.
• AUTOSCALE_WINDOW updates the value of the Window attribute. This is the range of numbers displayed along the axis.
IMSL charting is largely made up of classes that inherit from ChartNode. Therefore AbstractChartNode.AutoscaleOutput should be used to indicate how auto scaling is to be done. The default is AUTOSCALE_NUMBER |AUTOSCALE_WINDOW; both the attributes Number and Window are adjusted.
|
PHONE: 713.784.3131 FAX:713.781.9260 |